All products featured are independently chosen by us. However, SoundGuys may receive a commission on orders placed through its retail links. See our ethics statement.
What are the best sounding headphones?
May 19, 2023
Unsurprisingly, “what are the best headphones?” is a question we get asked a lot at SoundGuys, and our response is usually “it depends.” Where and how you want to use your headphones, your audio source, the size, shape, and weight you’re willing to put up with, features you can’t live without, and the cost you’re willing to shell out—are all important considerations. This website is testament to the fact there is no simple answer and that there is no one best headphone for every person and every situation.
When it comes to the best sounding headphones, that depends too. Everyone has individual preferences and needs when it comes to sound. But we have a rough idea of what headphones ought to sound like, and how they should measure on our test system. What sounds best to you is quite likely to be some variation on that. More on that later.
So how do we know what headphones should sound like? Let’s dig in.
Editor’s note: this is the first in a series of somewhat technical deep dives into the audio science, acoustics, and psychoacoustics involved in how headphones sound. If you’re really looking for specific headphone recommendations or a best list, here’s one.
What should headphones sound like?

Given that headphones were invented over a hundred years ago, you would think that by now everyone would have a pretty good idea of how they should sound. Unfortunately, if you look at the huge amount of variance in the performance of commercially available headphones, earbuds, and IEMs, there is apparently no clear consensus, and everyone seems have their own ideas of what’s right. However, some of these variations are expected, or at least explainable. Surely we can figure out what the right answer is.
There are a couple of ways to approach answering the question of what headphones should sound like.
Listening to headphones
Since there are already thousands of headphone designs out there in the world to listen to, we could start by listening to and comparing them to see which ones sound “right” to us. This would essentially be the same way reviewers have been judging headphones since the very beginning. But there are two major problems (and some minor ones) with that approach:
- Many factors can directly or indirectly influence the perception of the sound quality that aren’t related to the sound itself, such as brand recognition, price awareness, appearance, comfort, size, feel, and weight of the product.
- Any conclusions drawn would be based on the opinions of a very low number of listeners, and so will likely have limited validity for the population as a whole.
Headphone listener preference tests
With a well designed experiment, the above two problems can be addressed and overcome. So how would you go about designing this experiment?
In simple terms, we know that listener preferences for sound quality are absolutely dominated by one single characteristic of an audio product: its frequency response—so that’s where the focus should be. With the right test equipment, the frequency response of any headphone can be measured quite accurately. Once that data is captured, it can then be used to effectively impart that headphone’s frequency response on another (surrogate) headphone using equalization filters. With the application of these digital filters, it is quite simple to switch between the frequency responses of multiple headphones for playback on a single headphone, just like switching through equalizer presets on common headphone apps.
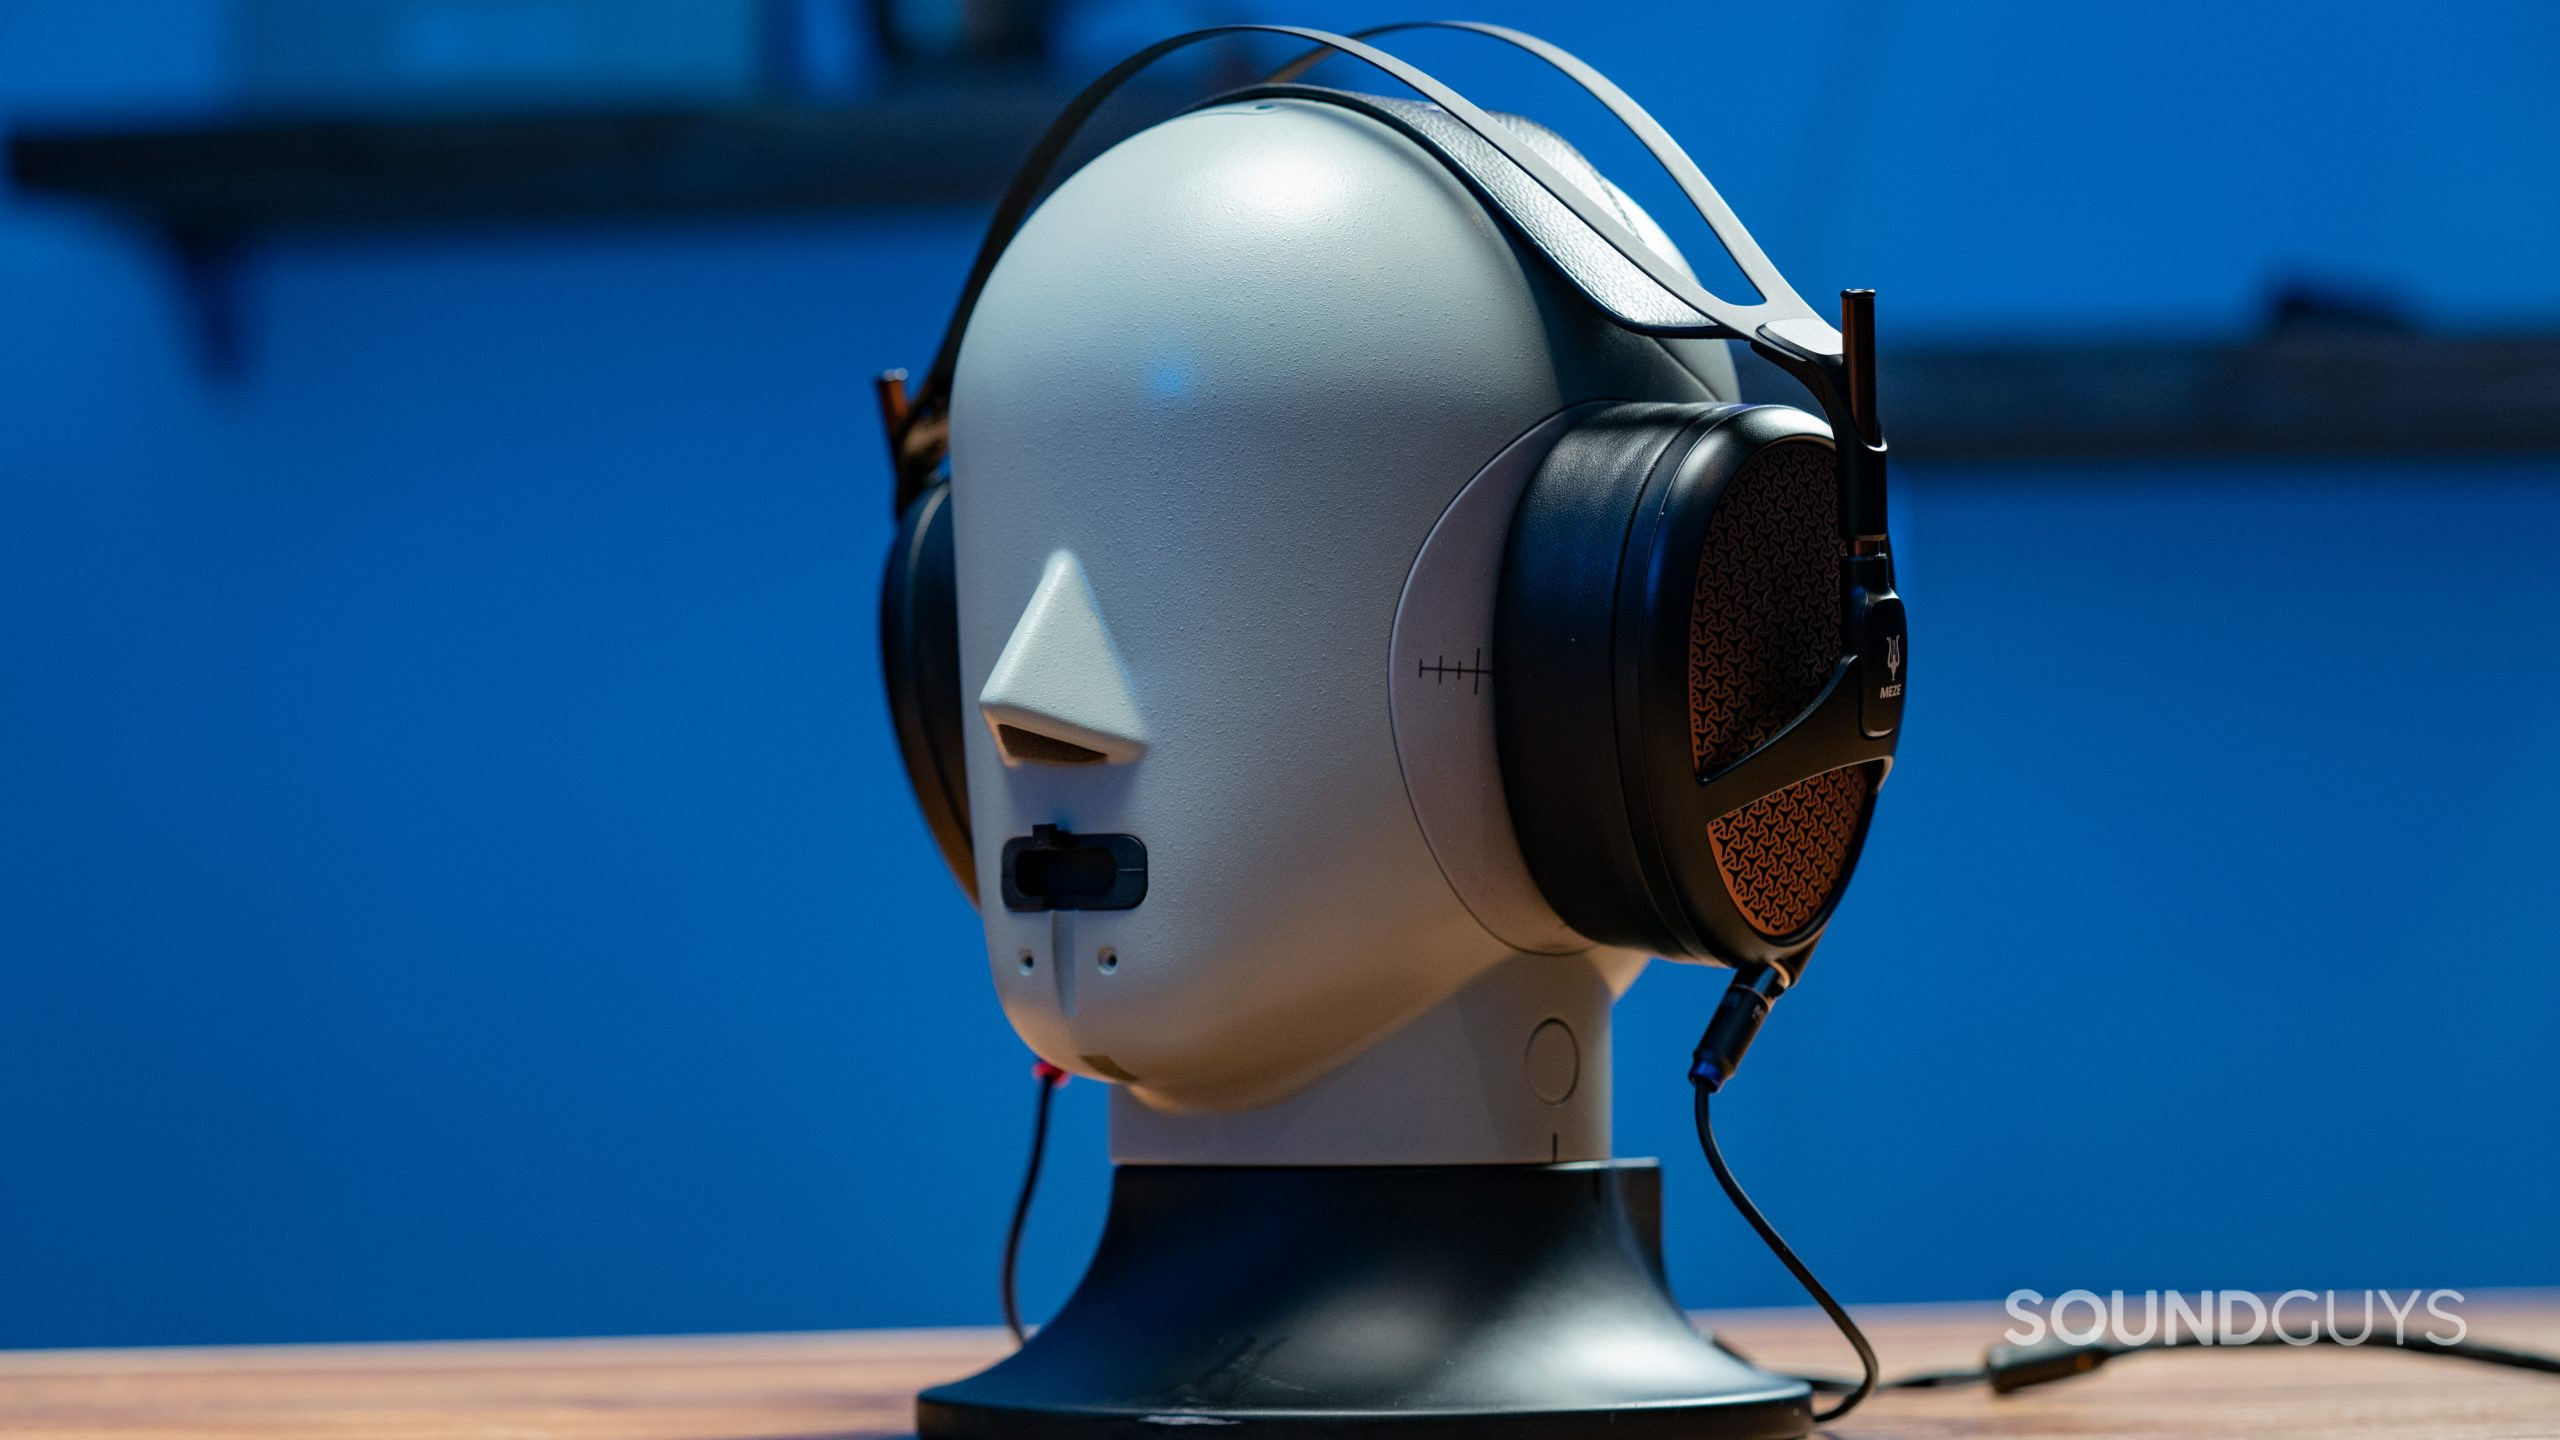
With a basic test setup, a number of different headphone responses can be presented to a volunteer listener without them having any idea of where the captured responses they are hearing came from. Effectively the devices being auditioned are anonymized, allowing the listeners to identify their preference based on the sound alone. To take it a step further, you could provide a simple tone control to the listeners in the experiment to allow them to adjust the bass and treble balance to really dial in their preference, and those results would be recorded.
By running this “virtual headphone” test on as many people as possible, the second problem (low number of listeners) is also addressed. Ideally the test would be run on trained and untrained listeners, on different demographics, and in different geographic regions, meaning listener preferences could be identified and examined in a number of ways. The primary outcome of this experiment would be a set of frequency curves that represent what the majority of the test listeners prefer.
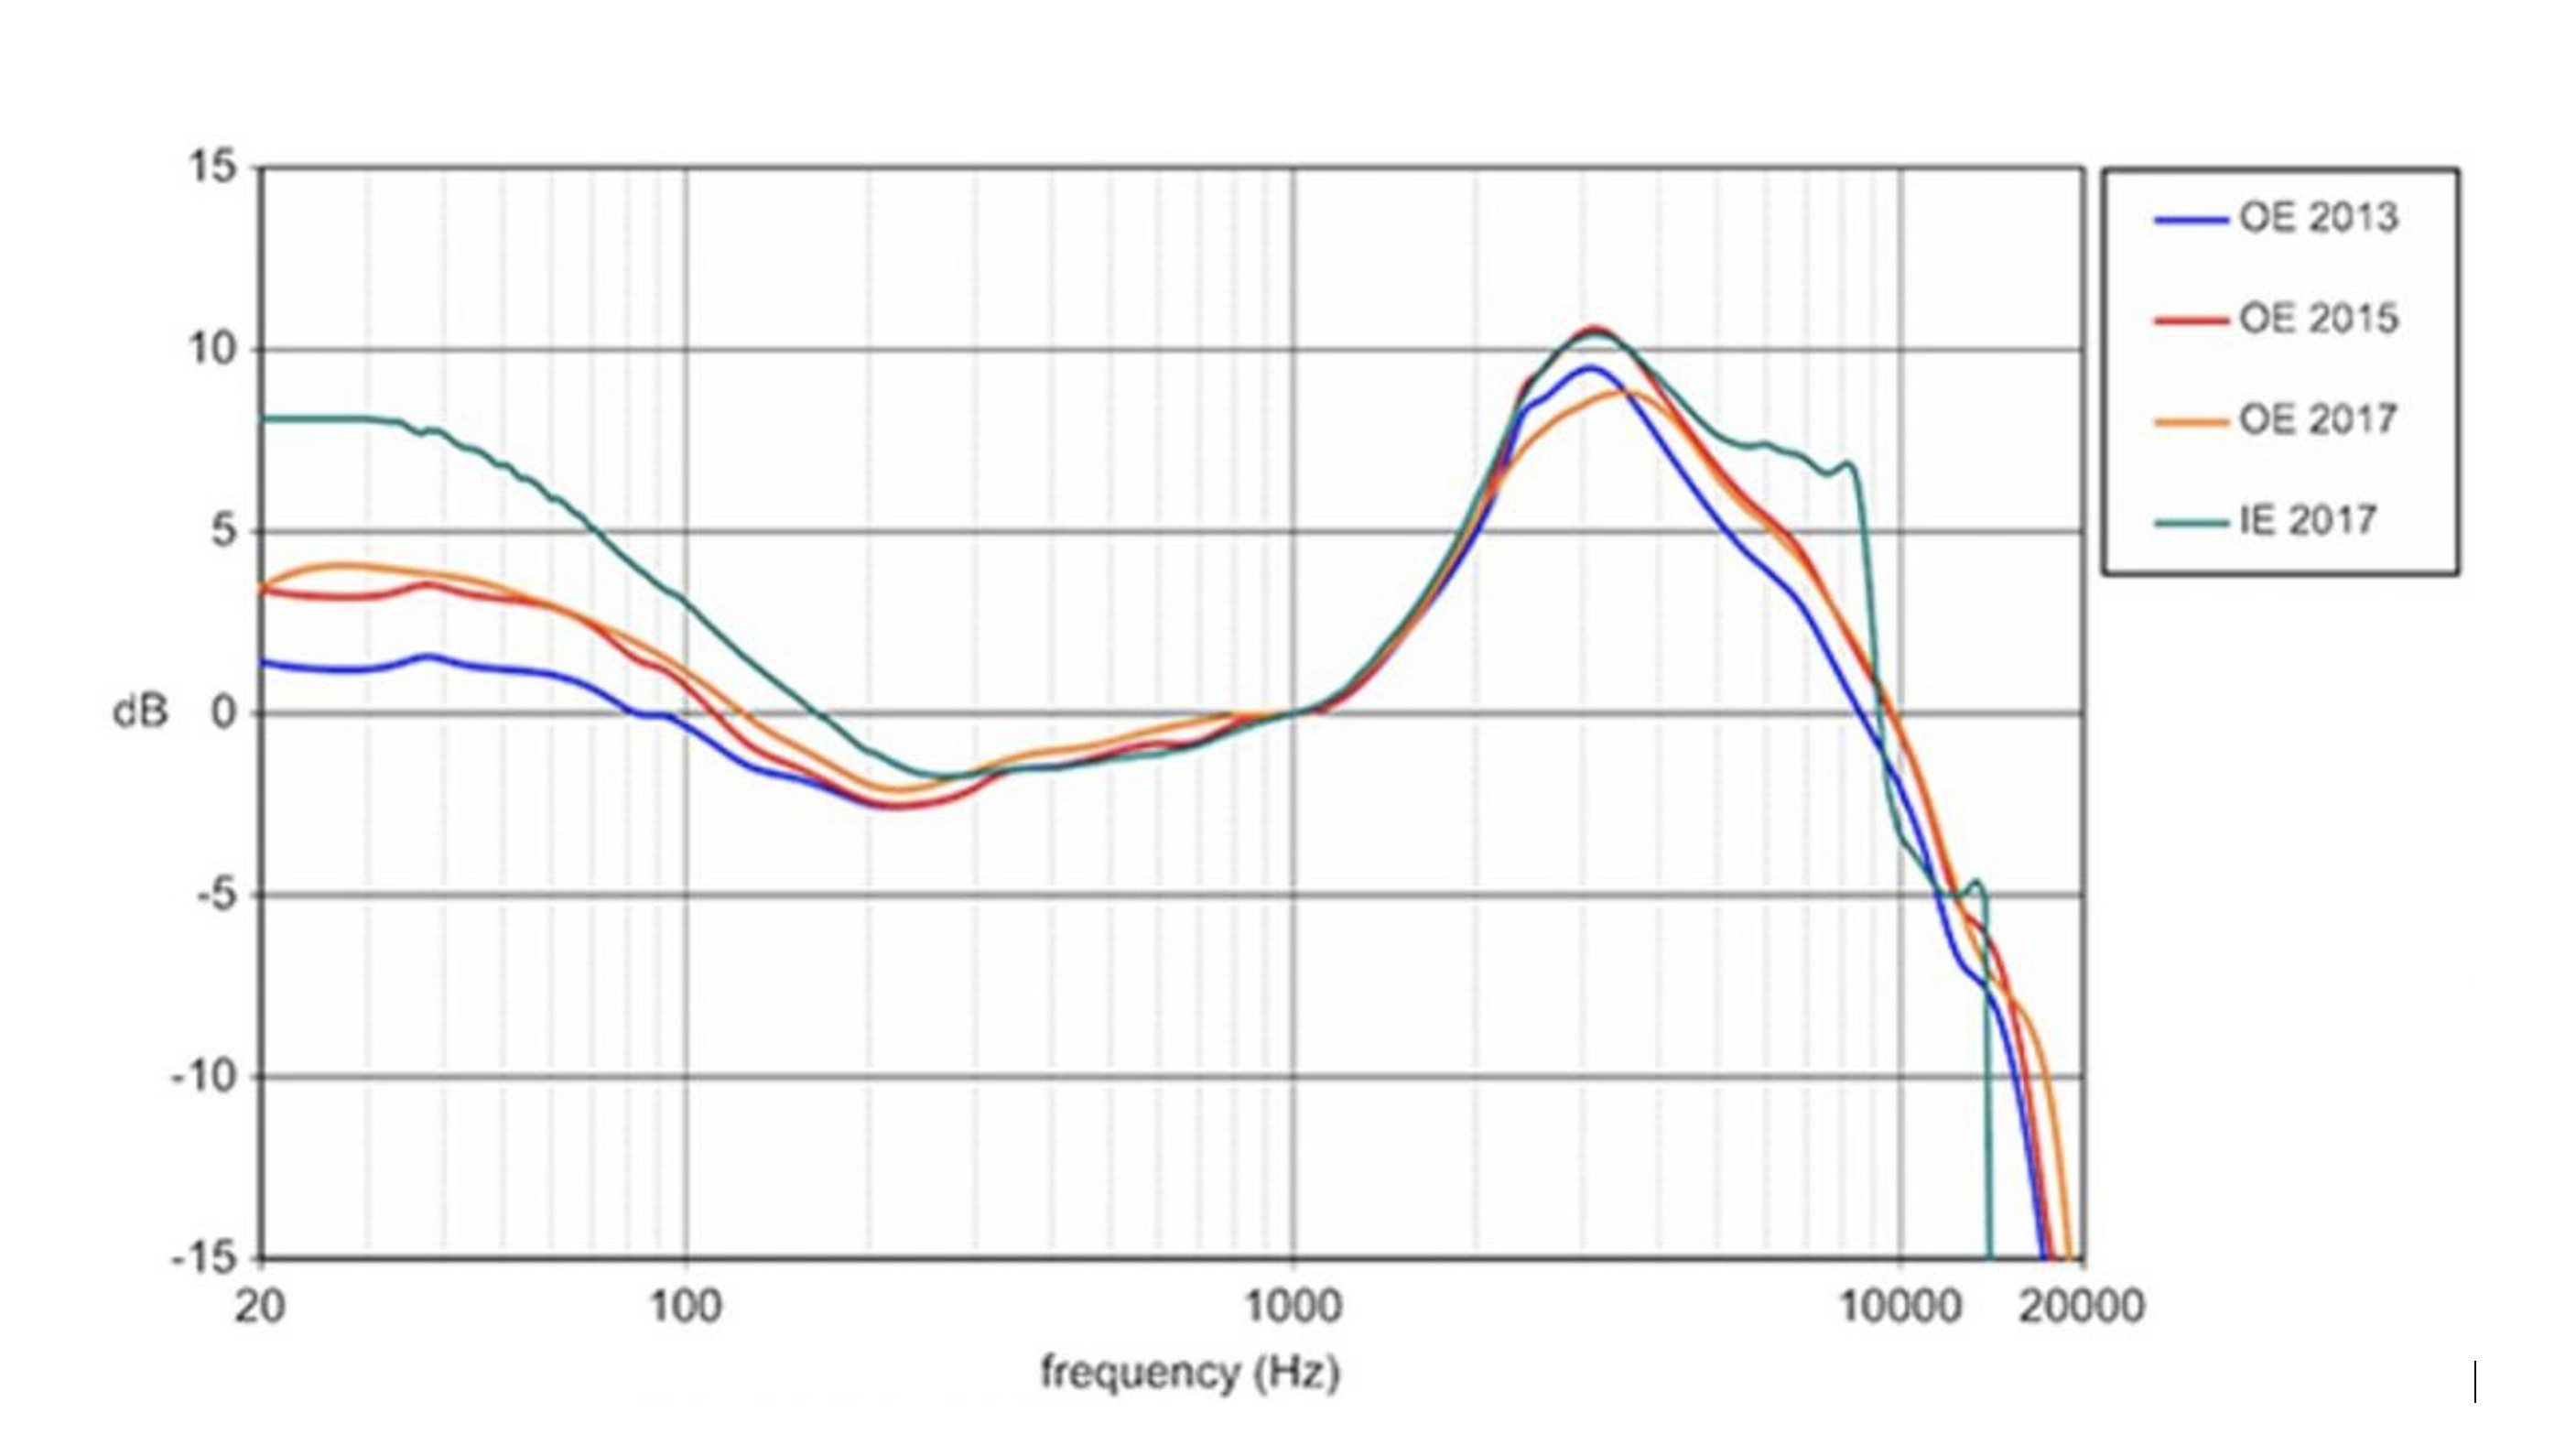
What I’ve described above is a summary of the work that Dr. Sean Olive and his team carried out to produce the HARMAN headphone listener preference curves. These frequency response curves are widely considered to be the best and most scientifically defensible (with 14 published papers) attempt anyone has made at answering the question of what headphones should sound like.
This work produced a validated model showing that the measured frequency response is correlated with listener preference. It should be noted though that Dr. Olive has stated the results are really only valid up to 10kHz, due to limitations of the test and the measurement fixture used (a modified GRAS 45CA). Therefore the HARMAN curves have limited usefulness, and importantly can’t be compared with or applied to measurements made on the Bruel & Kjaer 5128 test platform, which we use.
Comparison to loudspeaker preferences
Another approach to finding out what headphones ought to sound like is by looking at (listening to, and doing testing with) loudspeakers. After all, the vast majority of the content we listen to on our headphones was produced with the expectation of playback on loudspeakers first and foremost, so that experience should be replicated as much as possible on headphones.
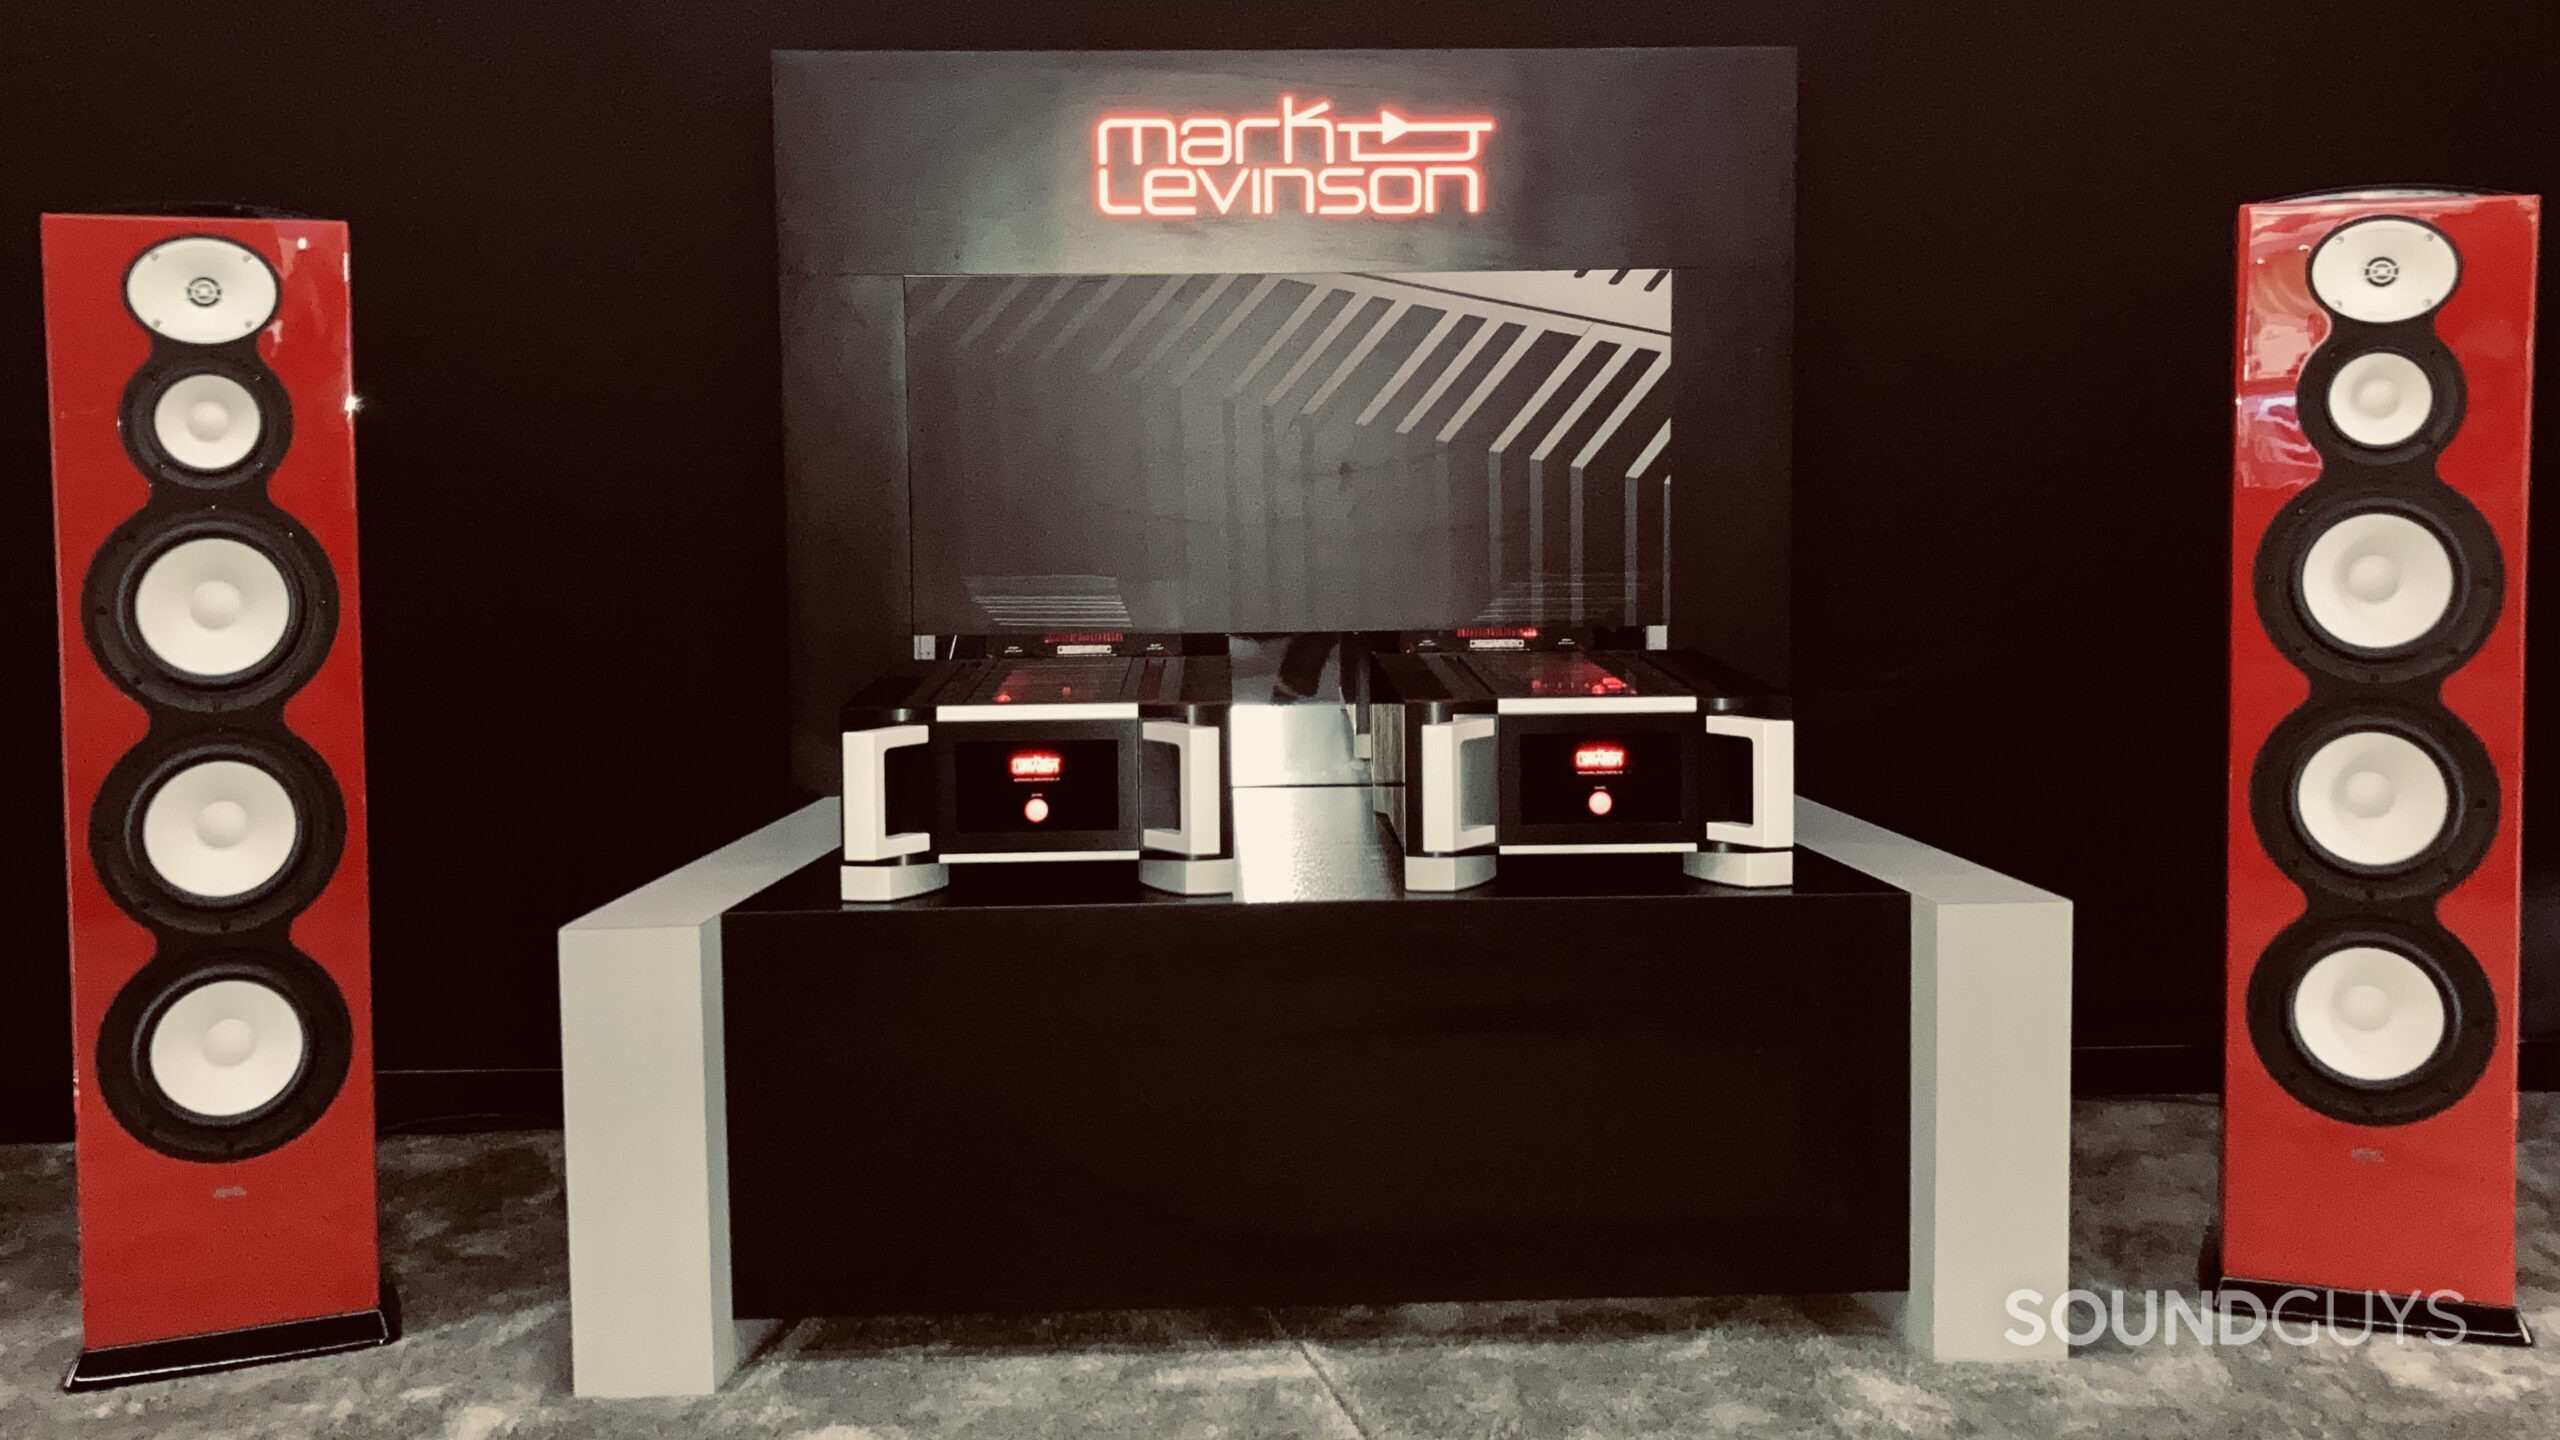
When we listen over loudspeakers, we hear the combination of the speakers and the effects of the room we are in. Rooms vary a lot in terms of size, shape, what’s in them, and how well they absorb sounds at different frequencies. This means each room has its own response in both the frequency and time domains, and that gets superimposed on what you hear.
At one extreme, you might have an empty room with bare walls that is extremely reverberant, like a bathroom. Or you could have a more typical living space with carpet, curtains, and soft furnishings like sofas that soak up sound energy, making things a lot clearer and less “echoey.”
If you were to go further to the extreme, incorporating lots of several feet thick purpose-built absorptive acoustic treatment on all surfaces of your room, you end up with what’s called an anechoic environment. Basically all sound gets absorbed, and none of it is reflected back into the room, so there’s no reverb and no echoes at all—it’s acoustically “dead.” It’s not a typical listening environment, but this kind of space is used to quantify loudspeaker performance in R&D labs, as the effect of the room itself is essentially taken out of the equation.
Most people’s listening environments fall somewhere in between these two extremes, with a mixture of soft furniture, carpeting, and hard reflective surfaces like windows and bare walls. Think of it as a semi-reflective environment.
Room acoustics have been studied and largely understood for some time. Thanks to the work of Floyd Toole and others, we know what is considered ideal in terms of the listening room and the behavior of the speakers in the room to give the best representation of the sound being reproduced. People prefer loudspeakers that have a frequency response that is as flat as possible, when measured on-axis, in the free-field (at a distance), in an anechoic room. Extensive listener preference studies have shown that a smooth, well-behaved off-axis response is preferred. When this is the case, measuring the sound power produced in the listening room produces a smooth, gradual slope downwards when viewed on a standard frequency response chart (below). That is to say that when you put well-designed loudspeakers in a typical (semi-reflective) room and measure the steady-state response (a combination of the direct and reflected sound), it will have a downward sloping frequency response profile.
On-axis is a term used when the sound source is directly in front of the listener (or microphone), and pointed towards them. This is denoted by the the 0-degree axis of a polar response chart. For loudspeakers, on-axis is usually considered to be directly in line with either the tweeter or the mid point between the tweeter and midrange driver. How a loudspeaker’s sound changes as you move off axis is an important aspect of its performance, described by its directional characteristics.
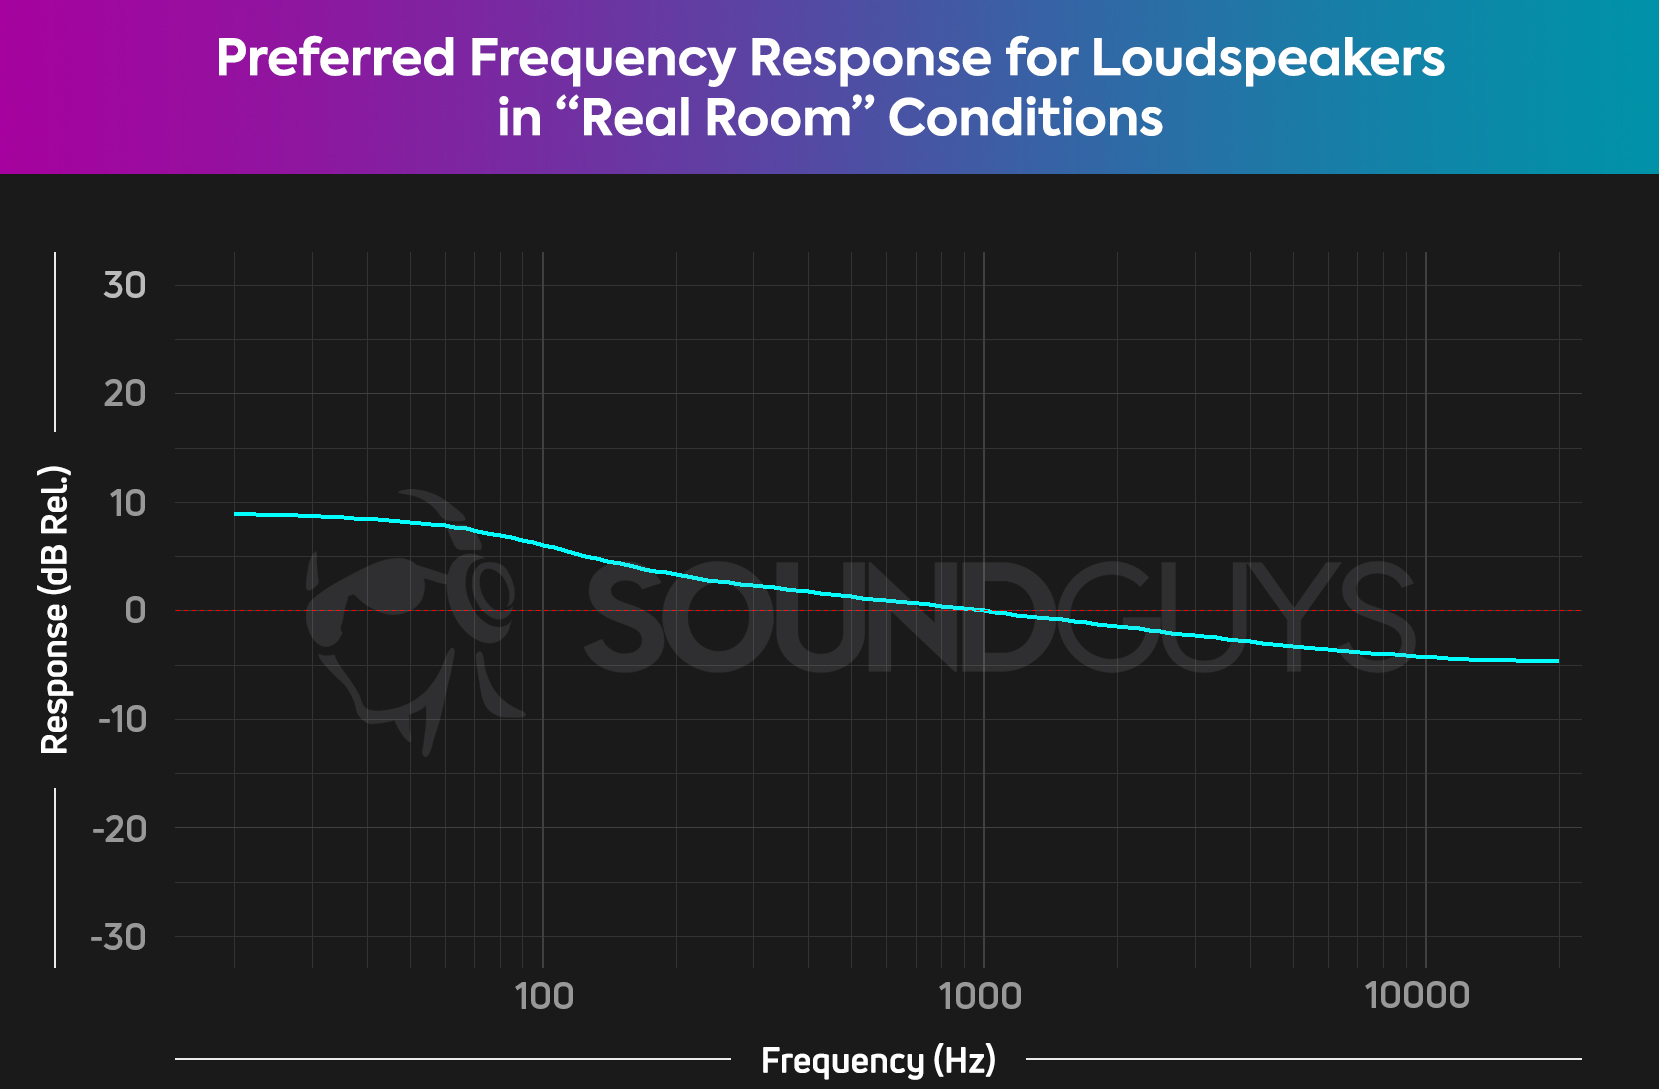
You could certainly make the case that since such extensive work has already been done on listener preferences with loudspeakers, it shouldn’t be necessary to repeat the exercise with headphones. After all, the same preference findings should apply to the spectral balance of the program material at each listener’s ears, regardless of whether it’s loudspeakers or headphones being used. It should simply be a matter of applying the correct transfer function from loudspeakers to the headphones.
We need this transfer function because it’s not as simple as saying that headphones should have the frequency response illustrated above, because we measure headphone responses at the effective eardrum of the test head, which means we have to take the effect of the ears, head and shoulders (known as the head related transfer function, or HRTF) into account. But this is complicated by the fact that the HRTF changes depending on which direction the sound is coming from.
Diffuse vs Free Field: which is correct?
Remember, with loudspeakers, we hear a combination of the direct sound from the speakers, and the reflected sounds coming from around us. If you consider the hard, reflective bathroom example, we will hear a considerable amount of sound reflected from the room all around us. If you measure the response at the eardrum when sound is coming from all around, you get something called the diffuse field response (DFR).
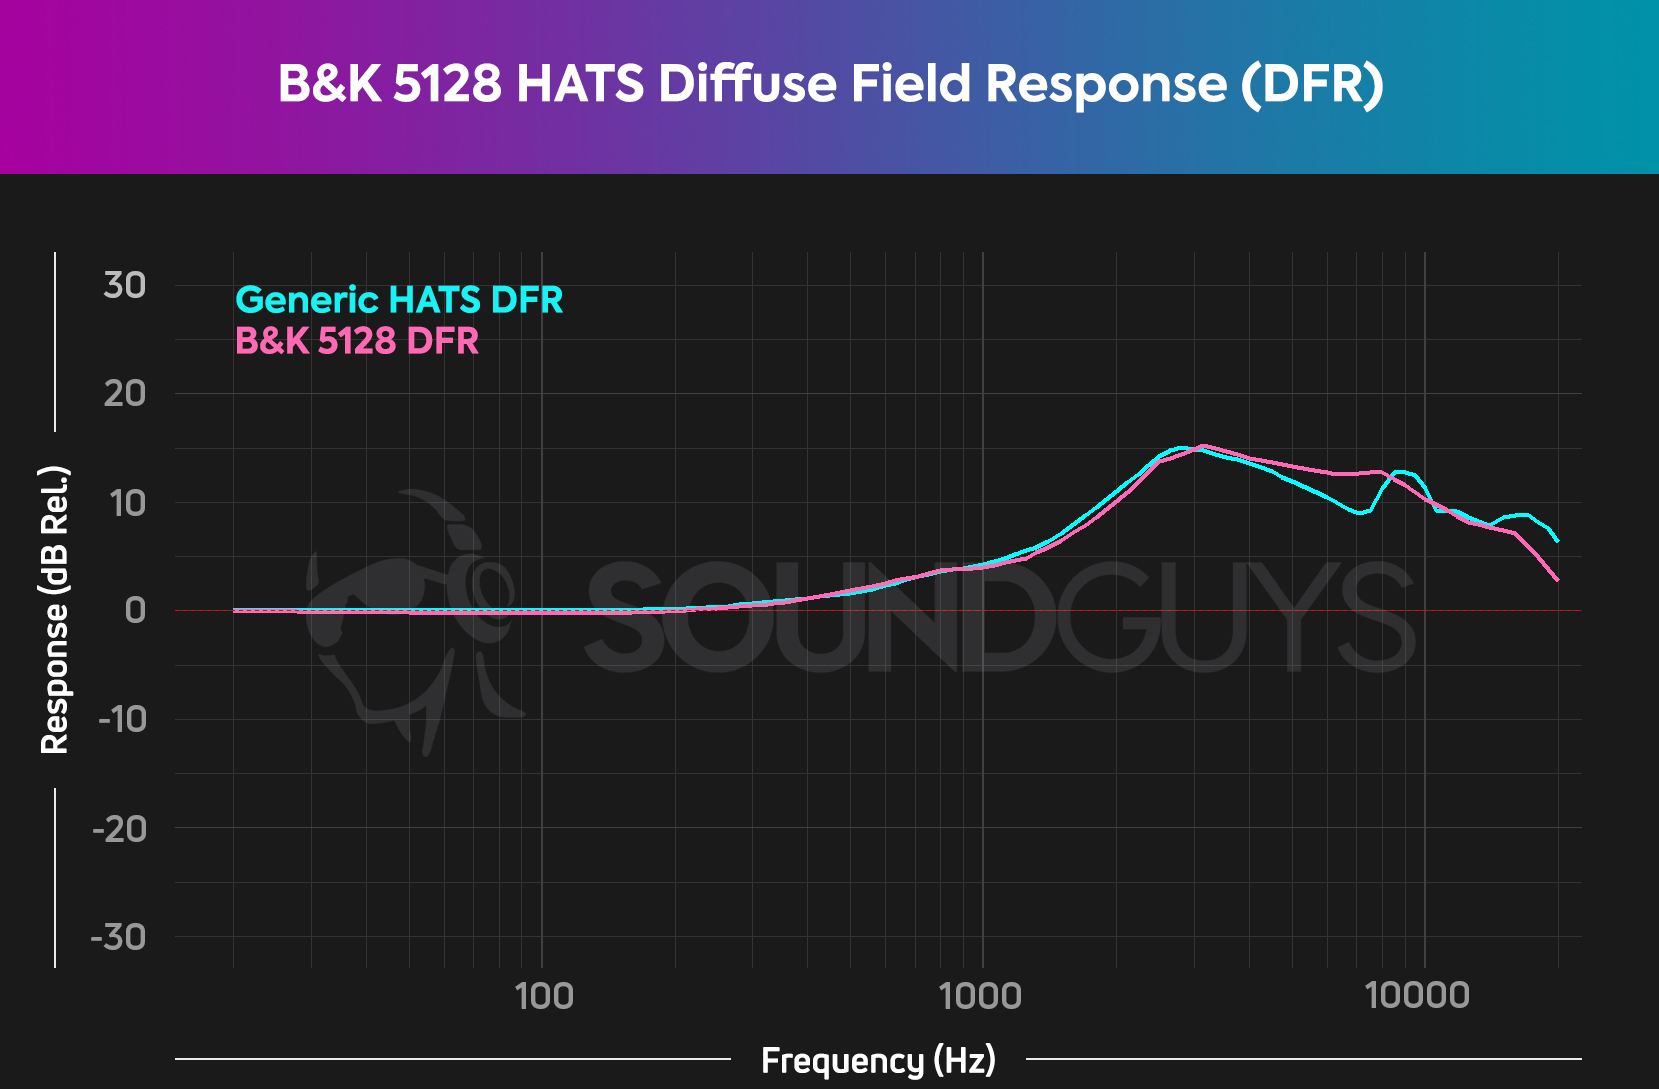
If you consider the heavily damped, anechoic room case, we will hear exclusively the direct sound from the loudspeaker, with no sound reflected from the room around us. If you measure the response at the eardrum when sound is coming from a single source, you get something called the free field response (FFR).
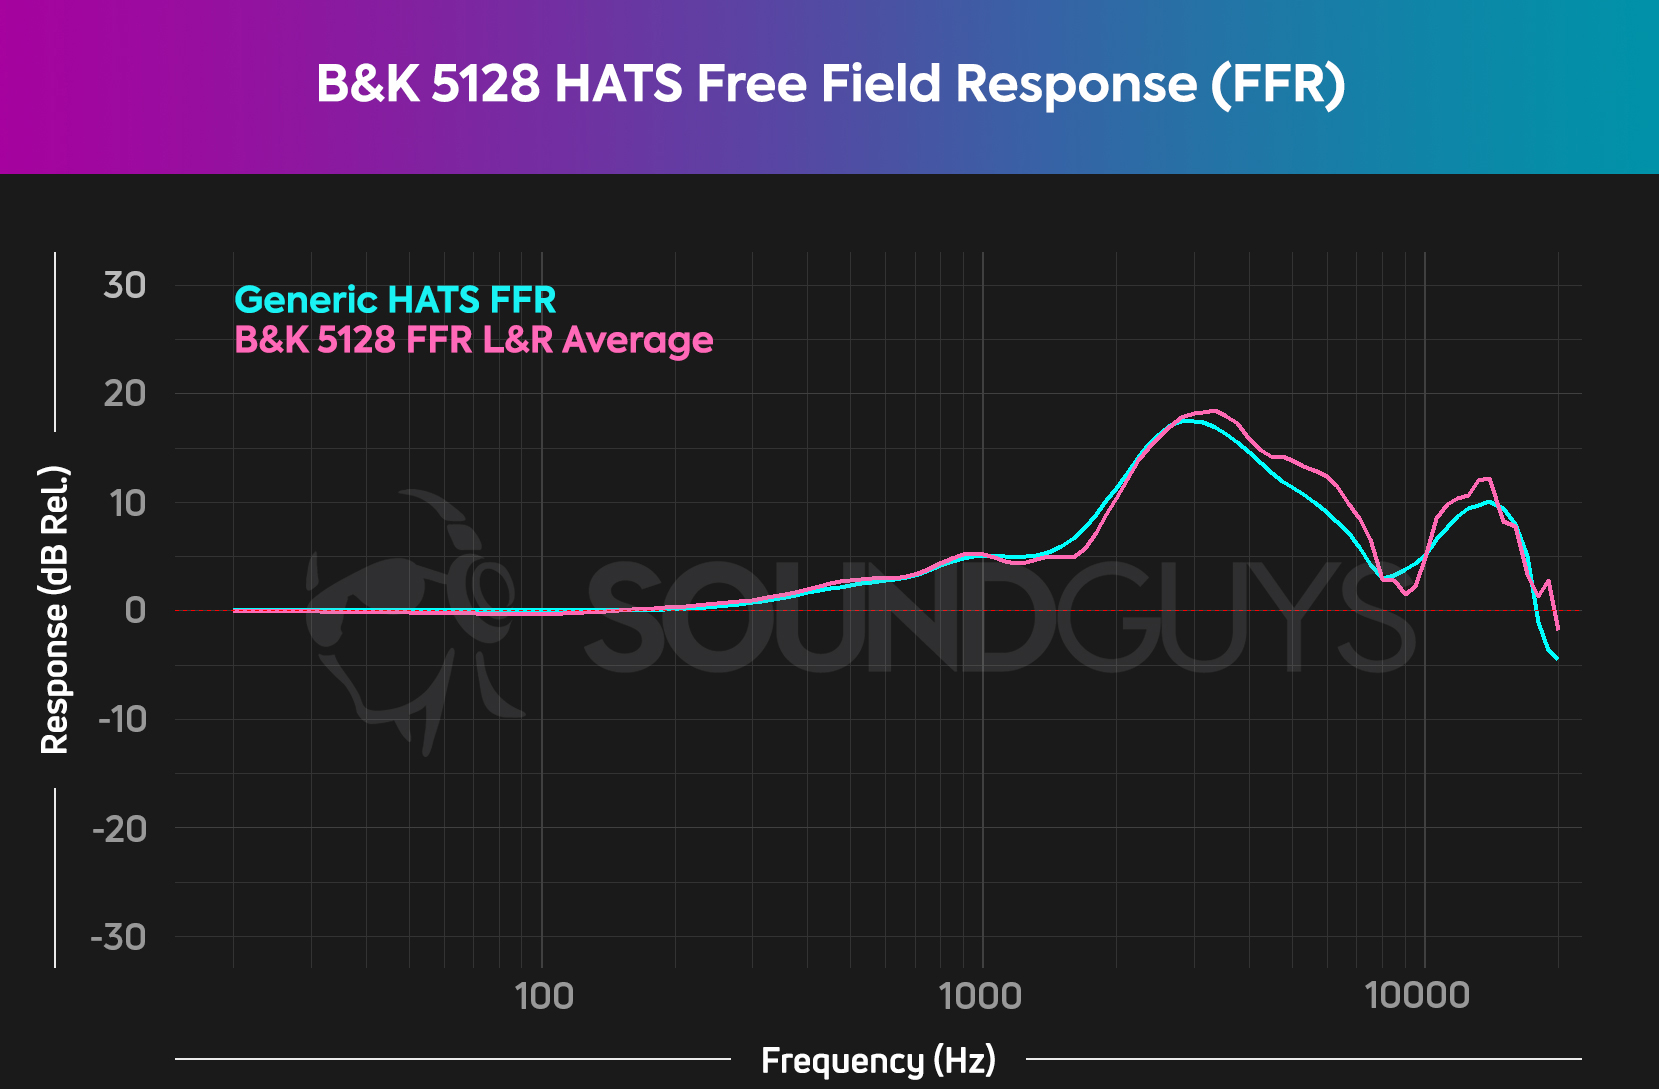
The above chart shows the effect of a generic HRTF on a single sound source directly in front, which would apply to a single (mono) loudspeaker, in an anechoic room.
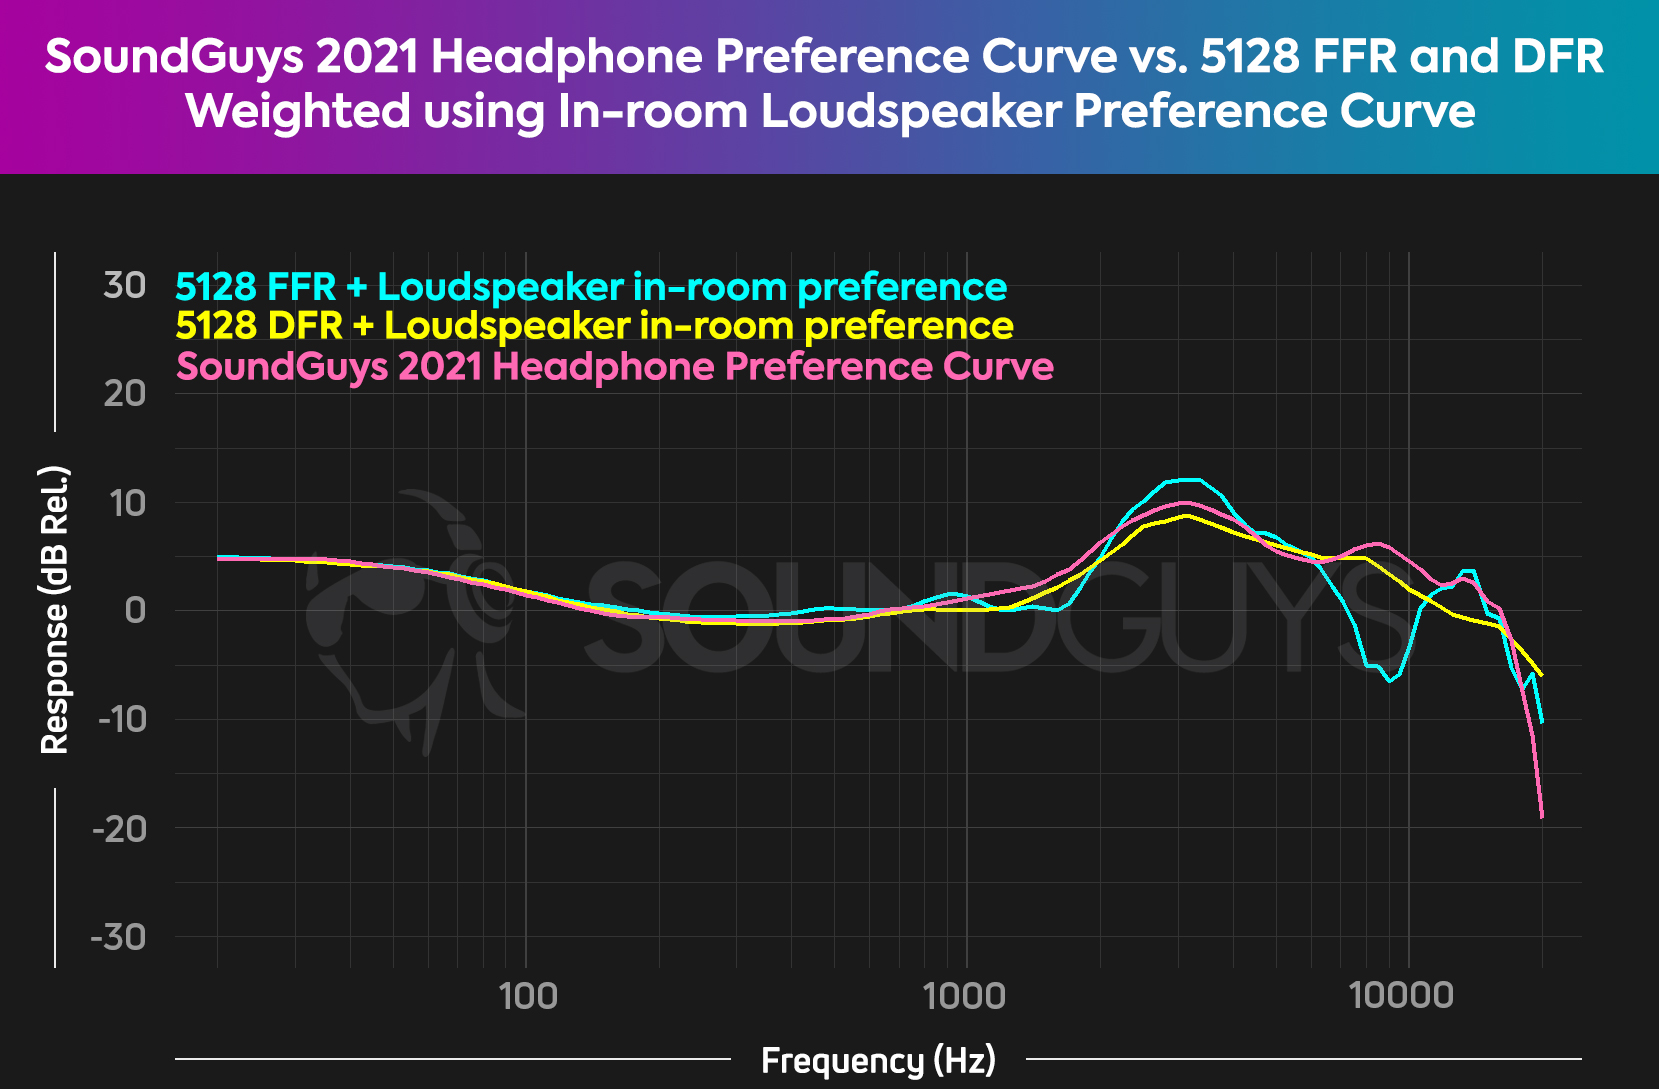
So if we apply the frequency curve derived from testing people’s loudspeaker listening preferences to both the diffuse and free field curves (where both assume that the source is flat when measured against frequency), we get two new results, which are applicable at the listener’s eardrum:
- One that is a theoretical preference curve for headphones to recreate listening to speakers in a bathroom.
- One that a theoretical preference curve for headphones to recreate listening to a single speaker whilst floating in space (aka an anechoic environment).
Clearly, neither of these is accurate in representing how we listen in real listening rooms, because a typical listening room contains some acoustic absorption and some reflective surfaces, so what we actually hear is likely to be somewhere in between these extremes. If we just consider the two scenarios above, our headphone’s response measured at the ear drum will be somewhere between the two frequency responses shown. If we plot them again on a single chart (below), we notice these curves each have a lot in common with the SoundGuys headphone preference curve (the one we developed in 2021 and have been using as our primary headphone reference since).
So what are the best sounding headphones?
We’re not quite there yet. We know a valid listener preference curve for headphones has been established using an outdated test fixture (HARMAN) that doesn’t apply to our system and is questionable at high frequencies. We’ve seen it’s also possible to derive a preference curve for headphones using the slope produced by listener preference testing for loudspeakers, when the appropriate HRTF is applied. However, choosing the curve that best represents the HRTF in a typical listening room needs careful consideration. Clearly using the diffuse field HRTF is not the right answer, regardless of the amount of “bass tilt” applied, because most people don’t consider very reflective rooms to be ideal for listening to music. But we don’t listen in anechoic chambers either.
If we believed the right answer to be a combination, a calculated average based on these 2 different cases, then our preference curve could do with minor tweaking, particularly between 7 and 11kHz. But we aren’t going to do that, not yet anyway. There’s more to it, and the most obvious thing is to address is that most of what we listen to currently is delivered in stereo, not mono, so we need to consider the angles from which the direct sound arrives at our ears.
We’ll get to that—and a few other details—in the next instalment of this series on the best sounding headphones. Stay tuned!