All products featured are independently chosen by us. However, SoundGuys may receive a commission on orders placed through its retail links. See our ethics statement.
The house curve: how we make our target headphone responses
August 28, 2024
When you browse through our headphone reviews, you’ll see we include charts showing, among other things, the measured frequency response of each product we test. The frequency response displayed on our current charts is an average of the unweighted, raw responses captured by the left and right artificial ears of our B&K 5128 head simulator when we play back a test stimulus signal through the headphones. To help you interpret this information, we also display a reference curve (colored pink) on the same chart, representing what we consider the ideal frequency response shape for the type of product you’re looking at. You might see this referred to as the SoundGuys “House Curve,” “Target Curve,” or “Headphone Preference Curve.” If you’ve ever been curious about this, it’s what we’ll be going over in this article.
Editor’s note: this article was updated on October 17, 2024, to note the inclusion of the SoundGuys Headphone Preference Curve in Harman’s latest research.
What exactly is a target response curve?
A frequency response graph provides a lot of information about how a headphone will sound because it visually represents the sound balance. The graph shows the objective quality of the cans. It doesn’t tell the whole story but does give you an idea of how they sound, regardless of perception. But we all perceive headphones differently. Such is the problem with subjective experience: it is only valuable to you as an individual.
Frequency response graphs show the objective quality... But, we all perceive headphones differently.
We provide a preference target response curve as a visual reference representing what we believe is a response shape most people will enjoy. It is a comparative reference showing how the product under test’s measured behavior compares with a theoretical model that has made a positive subjective impression across multiple listeners. So basically, the closer the measured product response is to the target, the more confidence we have that people will like the sound.
How do we know what sounds good?
Over the years, we’ve both listened to and measured a lot of headphones (close to 700 at the time of writing) and other products and amassed a lot of test data. Unfortunately, before we acquired our prized B&K 5128 test head and underwent our measurement system overhaul in early 2021, our test setup was less than ideal and much less accurate in replicating human physiology. But we could still do a good job of identifying great-sounding products or separating the wheat from the chaff to reach for a handy idiom.
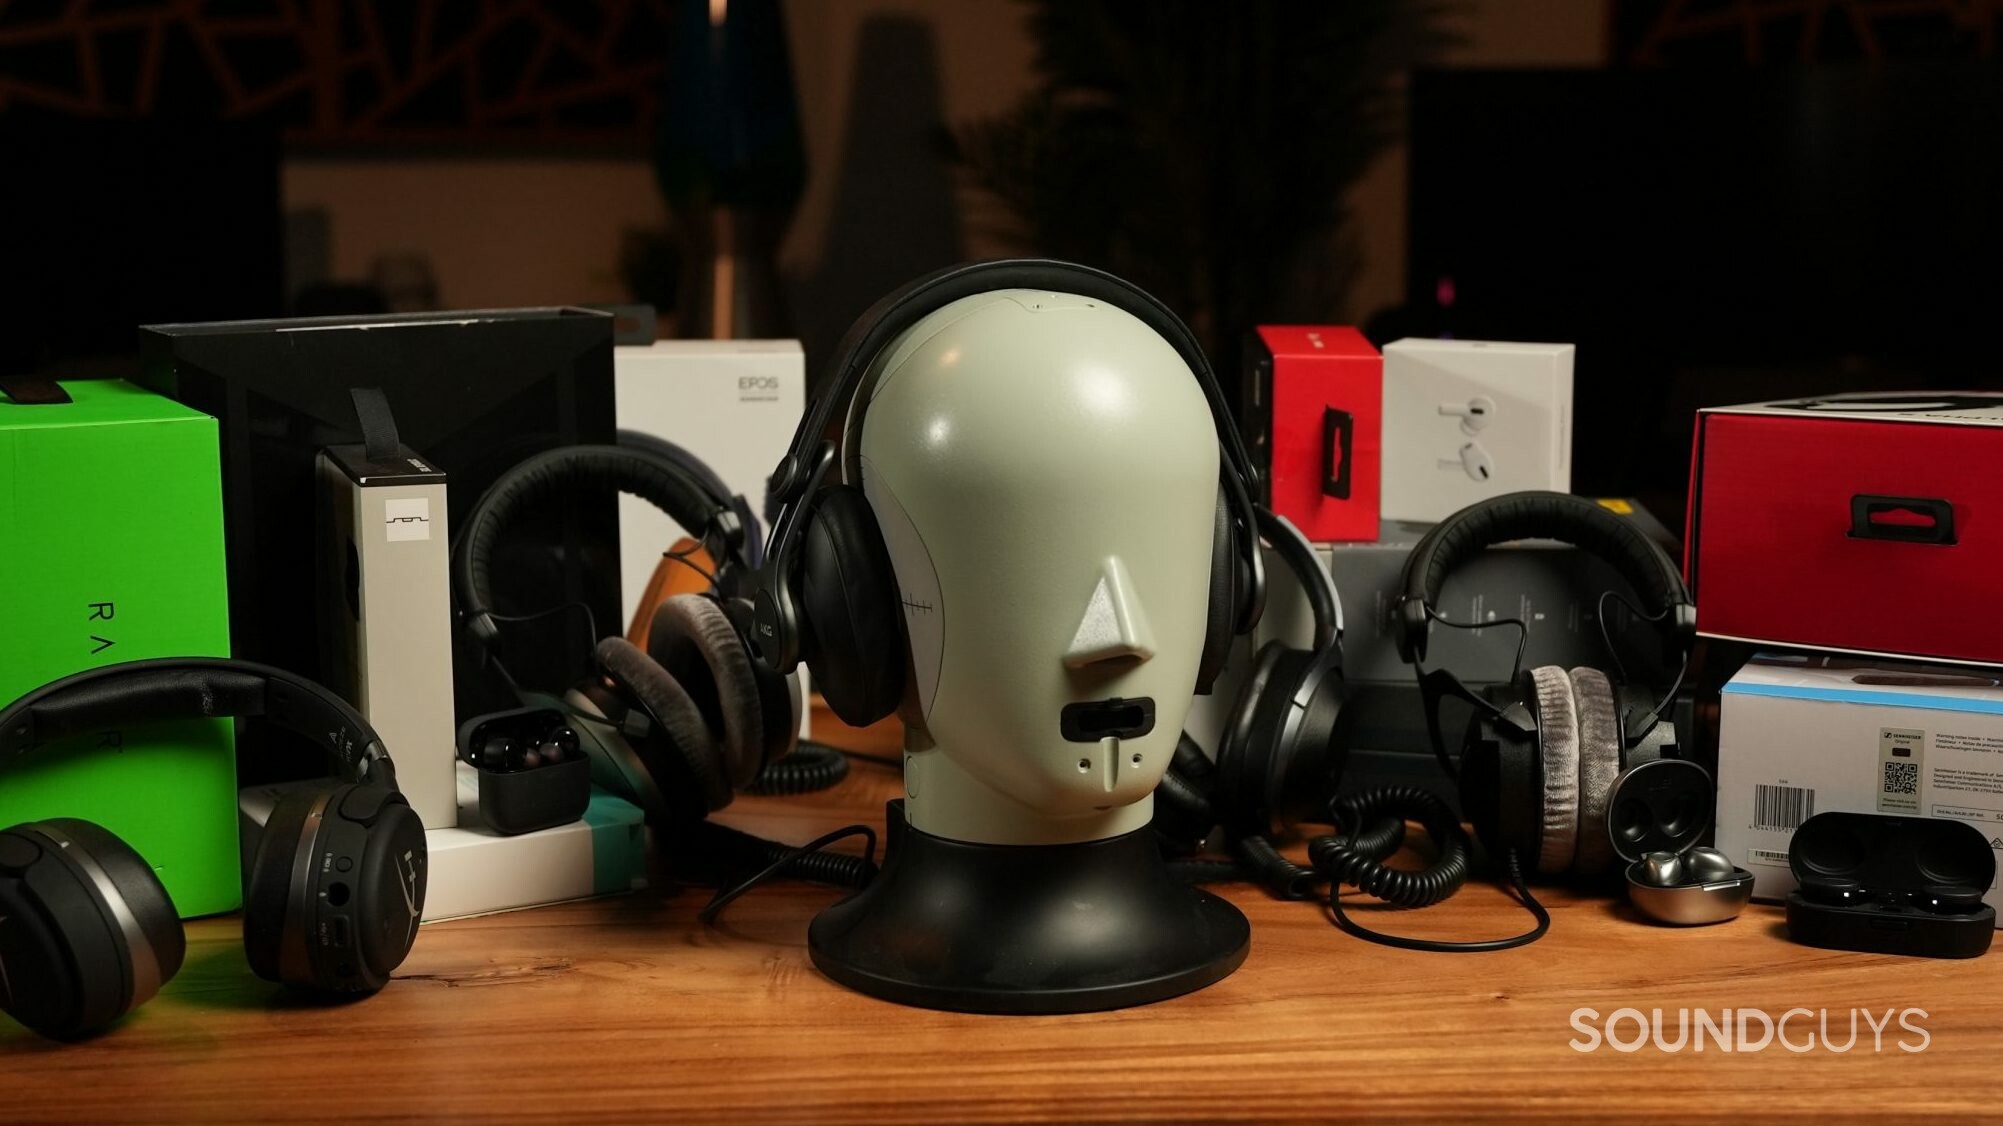
Since the upgrade, we revisited some benchmark products and remeasured them on the new system once it was all calibrated. We updated many older product reviews with new data for consistency and threw the benchmark measurements into a pile labeled “for reference.”
That pile gets added to every time we identify a benchmark product, which is generally a standout product that our technical team agrees does a great job of catering to the headphone market by providing a pleasing, enjoyable sound that we can all get along with. Products we identified don’t necessarily have to appear on our best lists or be considered popular products based on sales metrics, but by the same token, they may be.
How did we develop our curve?
This is where subjective perception and objective measurement meet and hopefully produce something worthwhile. Once our pile of reference measurements represented a cross-section of the current headphone market in terms of headphone styles—including in-ear, over-ear, open, and closed designs, plus various driver types—we loaded those measurement data into a spreadsheet. We crunched them down to produce our calculated preference curve.
The compendium of reference headphone products used includes recent AKG, Apple, Audeze, Bose, Google, Jabra, KEF, Monoprice, Shure, and Sony headphones.
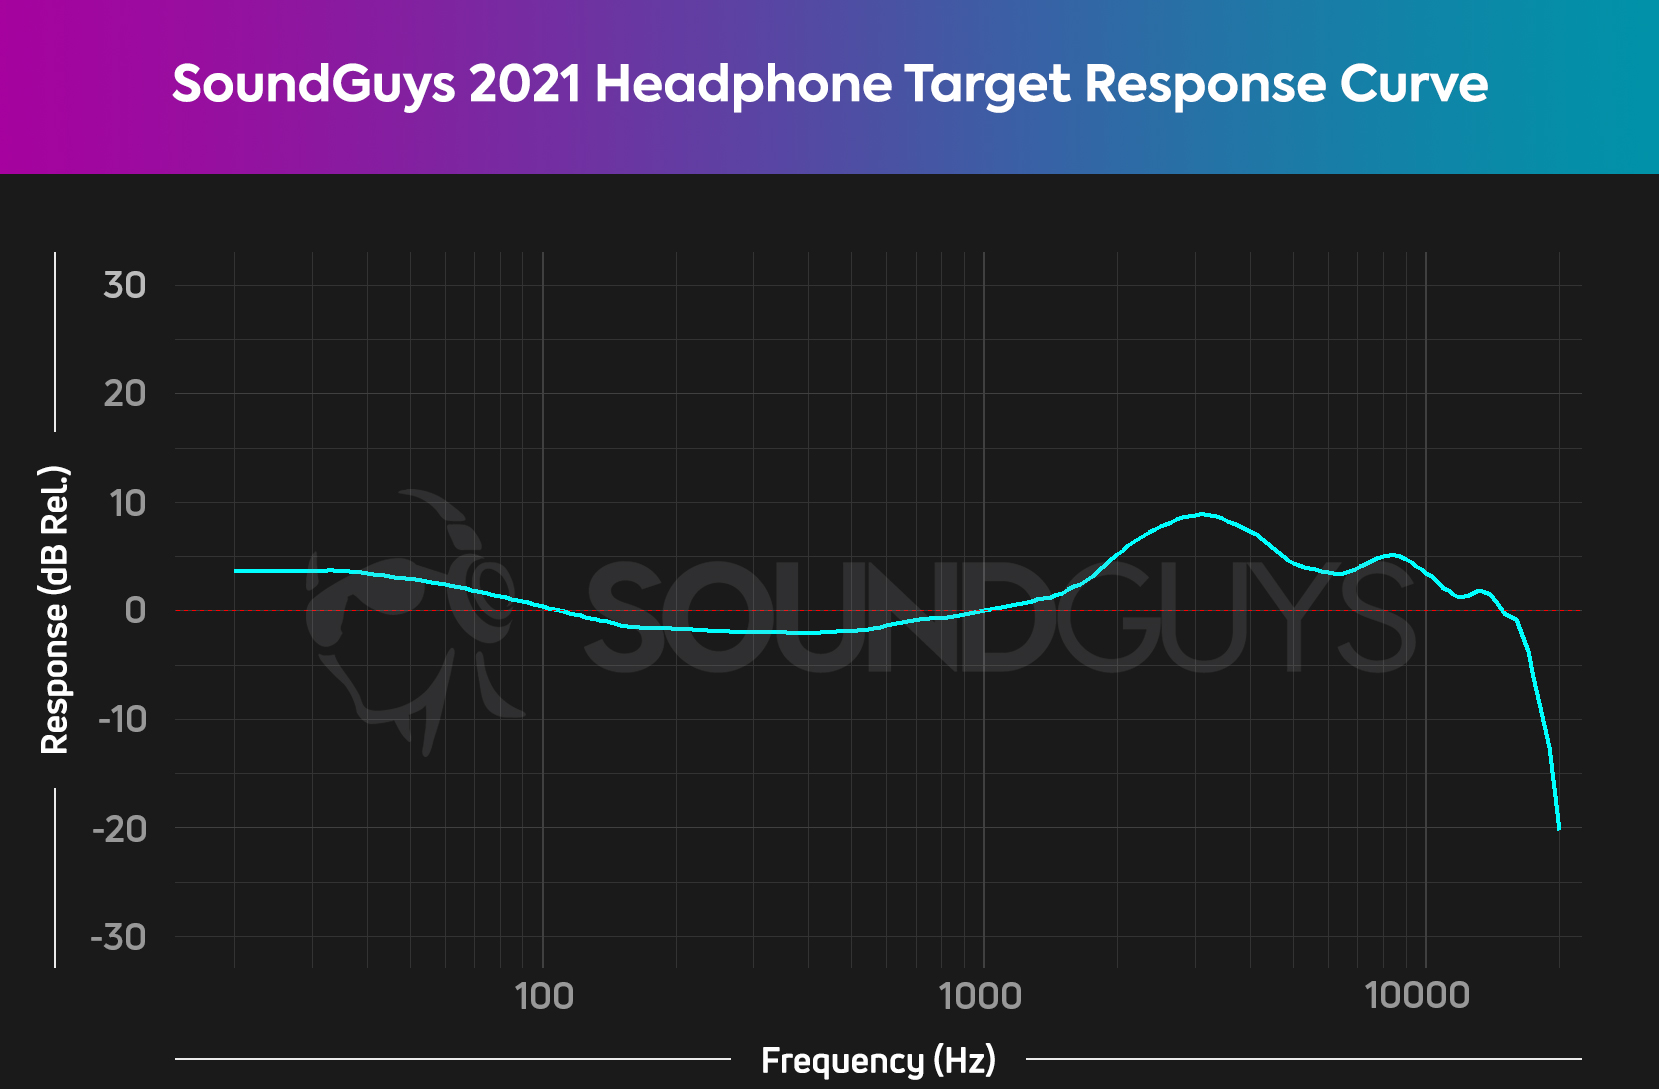
The output of this exercise is shown above, the 2021 SoundGuys Headphone Preference Curve (aka SoundGuys Curve v2.0). This is basically what we think headphones should sound like.
We are by no means the first to consider and attempt to define a preference target for headphone frequency response. It’s been done with much more thought and resources than we at SoundGuys could ever hope for…
How does the SoundGuys curve compare with the Harman curve?
In the early 2010s, Dr. Sean Olive (a senior fellow at Harman International, now part of Samsung) and his colleagues conducted blind listening tests to determine what sound profile most headphone listeners like. The initial work involved just six headphones and ten listeners, but the resulting 2012 paper, titled “The Relationship Between Perception and Measurement of Headphone Sound Quality,” made a big impression. Dr Olive and his colleagues then built on this work and ran hundreds more tests worldwide, resulting in a further eighteen published papers.
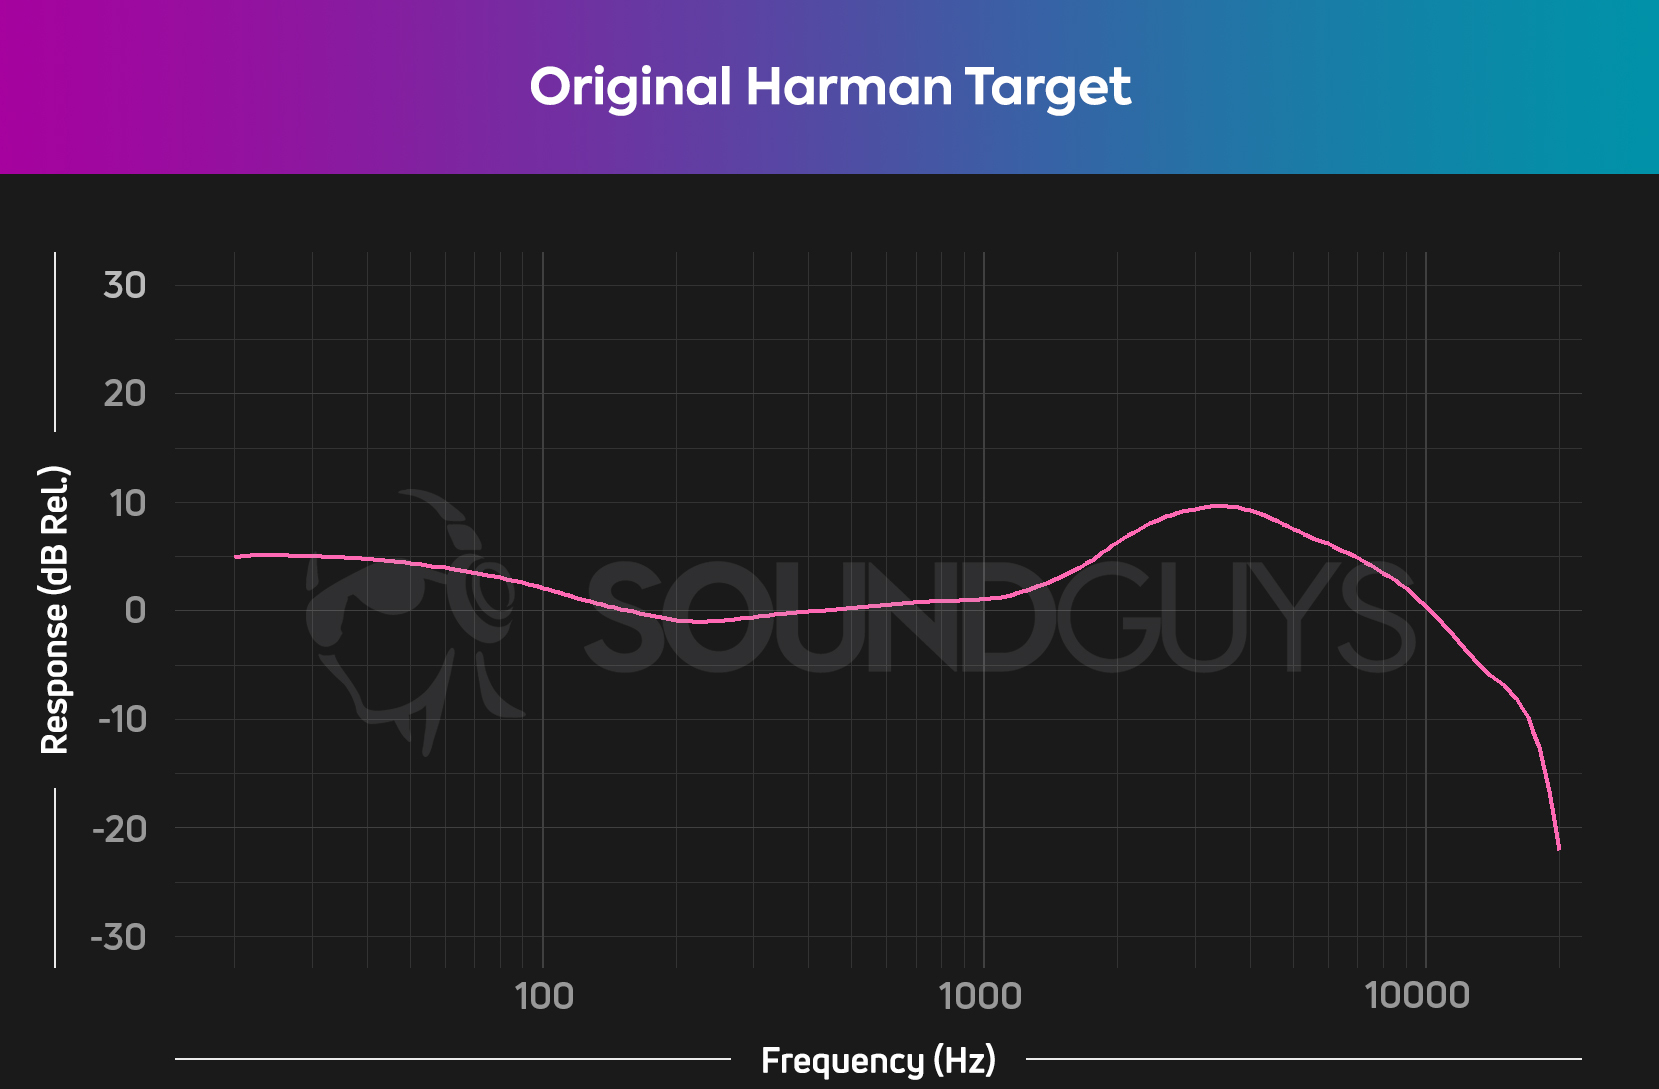
The culmination of this research is known as the “Harman Curve,” a specific target for frequency response, as preferred by most listeners. Admirably, Harman published its findings, allowing others (including their competitors) to benefit from the research that led to the Harman Curve. When measuring the response of a headphone prototype using an ear simulator, headphone designers can quickly get an idea of how close they are to a “good sound.” This is much faster than running listening tests with multiple listeners.
What does the Harman curve sound like? Theoretically, it makes headphones sound much like a good set of stereo speakers in a good listening room, but without any crosstalk or reverberation.
How does the SoundGuys curve compare with the the diffuse field response?
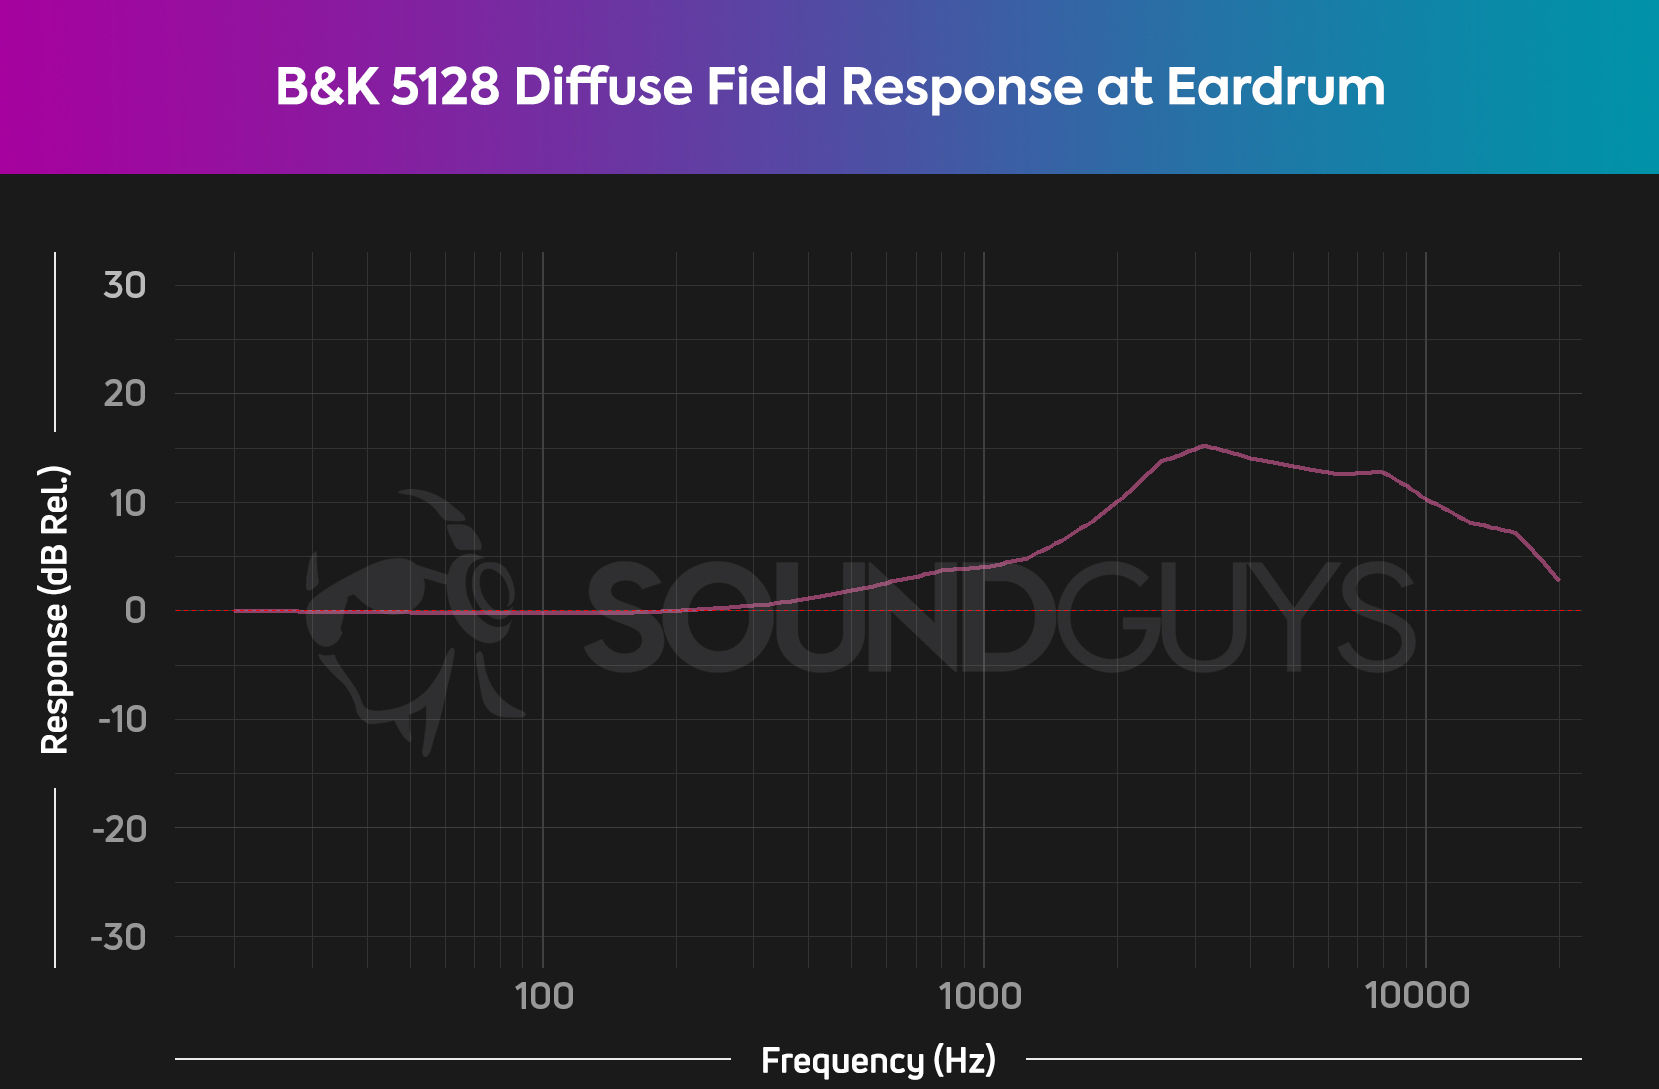
If you were to measure the acoustic output from a flat measuring loudspeaker in an untreated, reflective room at your eardrum, the response shape you would get would include the effects of your head, shoulders and ears. What you’ll measure at the ear can be approximated by a transfer function (shown above), referred to as the diffuse field response. Unsurprisingly, the upper midrange and high frequency boost this response provides is reflected in the shape of the Harman Curve, too. You’ll also notice that the Harman curve includes a bass boost to replicate the low-frequency enhancement that a typical room gives to loudspeakers (known as room gain) and a factor in the listeners’ preferences in the tests.
Sadly for us, the Harman response curve was developed using a different artificial ear fixture (a modified GRAS 45CA) than the ones in our test head (Bruel & Kjaer Type 4620), and Harman hadn’t released a version for use with the B&K 5128 test head until years later. So, we couldn’t do a side-by-side comparison of our curve and the one produced by the Harman research.
Why not create separate curves for the different headphone styles?
You may be wondering, if we’re pulling in data that includes measurements of different headphone styles, why not create separate ideal curves for in-ears or gaming headphones, for example? That’s a good question, and our answer here is relatively straightforward: What you hear matters; therefore, what matters is what reaches your eardrums.
We believe that the type of headphone we're wearing shouldn't impact our sonic preferences or ideal performance characteristics
We measure the acoustic signals at what are effectively the eardrums of our artificial head, and it is that physical location that our curve intends to serve. Like in a proper blind listening test with different loudspeakers — the size or type of speaker shouldn’t influence your choices — we believe that the type of headphone we’re wearing shouldn’t affect our sonic preferences or ideal performance characteristics.
What about headphones intended for professionals?
When it comes to studio headphones — by which we mean those products designed to meet the needs of audio professionals working in sound creation and audio production — we’ve recognized there might be a need for different target responses. Many legacy headphone products relied upon by those in the content creation industry have been around for a while and were designed when the philosophy of headphone design was a little different. There are still plenty of headphones being produced to meet this sound profile, suggesting that there’s demand for this approach, so we acknowledge that with our “legacy” Studio frequency response target curve.
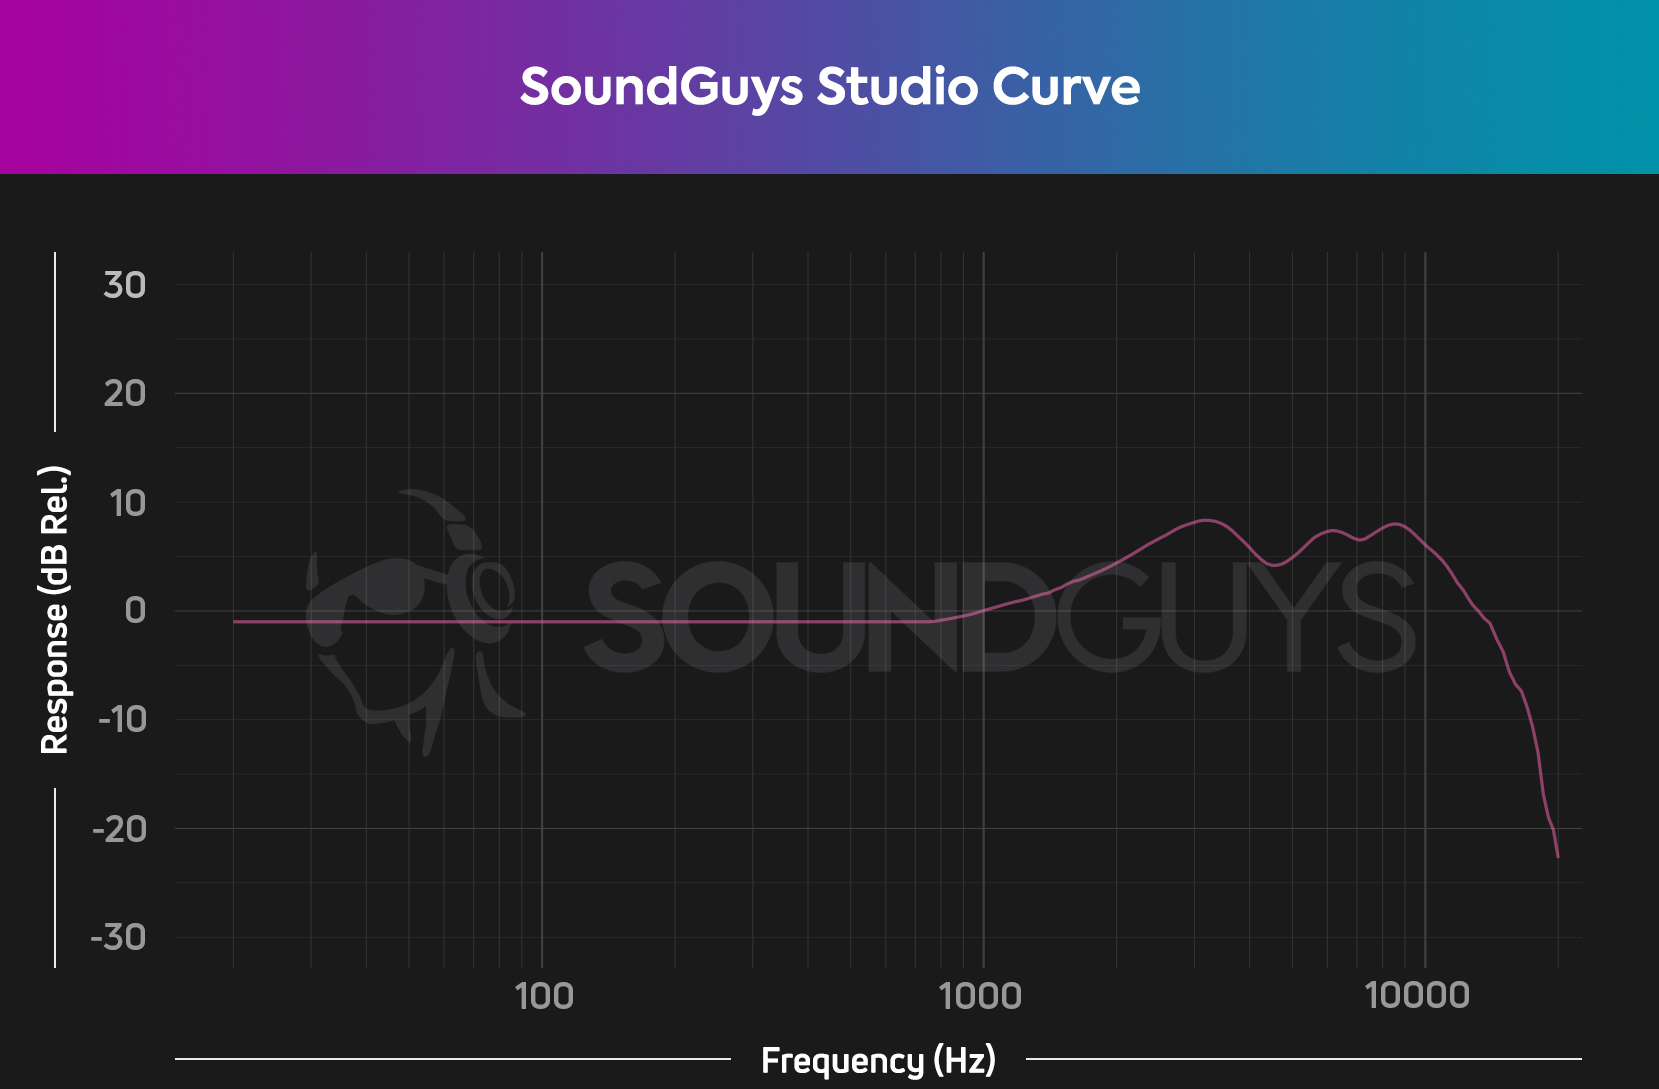
To produce this curve, we used a similar process to the one we used to develop the standard SoundGuys preference curve, detailed above. First, we identified benchmark products, which we measured and then averaged together before applying smoothing to produce our target. We measured data using multiple headphone and IEM models from Beyerdynamic, Sennheiser, and others.
Why isn’t the target curve for studio headphones flat?
Our legacy target curve for studio headphones isn’t flat because a headphone that measures flat on our test setup would sound very dull, and there’s a reason for this. We know that studio monitor speakers are designed to produce a flat frequency response on-axis, measured in the anechoic free field. But consider, as we discussed above, that when you observe the sound pressure at a person’s eardrum while listening to a “flat” speaker in a room, the response is pretty far from flat (see the diffuse field response curve above).
The response at a person's eardrum when they're listening to a loudspeaker with a flat response is pretty far from flat.
![Beyerdynamic DT 990 Pro[F] Best headphones under $200: The Beyerdynamic DT 990 Pro being worn by Adam Molina.](https://www.soundguys.com/wp-content/uploads/2017/11/Beyerdynamic-DT-990-ProF.jpg)
As you can see from our graph, it’s similar to the diffuse field response. On the one hand, we have our theoretical idea of what should work (and keep in mind we don’t produce headphones); on the other hand, we have data from actual products by brands that have spent decades developing headphones for professionals and have found massive success doing so.
How do we know our curve sounds good?
In the intervening years since we’ve debuted the SoundGuys Headphone Preference Curve, it has been included in multiple listening studies.
- First, it was validated for over-ear headphones in a study led by Senselab in 2023.
- Then, it passed a gut-check for in-ears by a Harman research pilot study conducted by Dr. Sean Olive in early 2024.
- Finally, the curve was validated alongside the Harman IE 2019 Target specific to the B&K 5128 for use with in-ears in a published study for AES on October 8, 2024.
For those keeping score at home, that’s validation for both over-ears and in-ears — that’s a big deal. To our knowledge, no other universal target enjoys this level of attestation for the B&K 5128, much less from an audio publication. We are incredibly lucky to have had so much effort paid into studying this and we thank both Senselab and Dr. Sean Olive for including our preference curve in their work. It’s also enormously helpful that it’s available to the public.
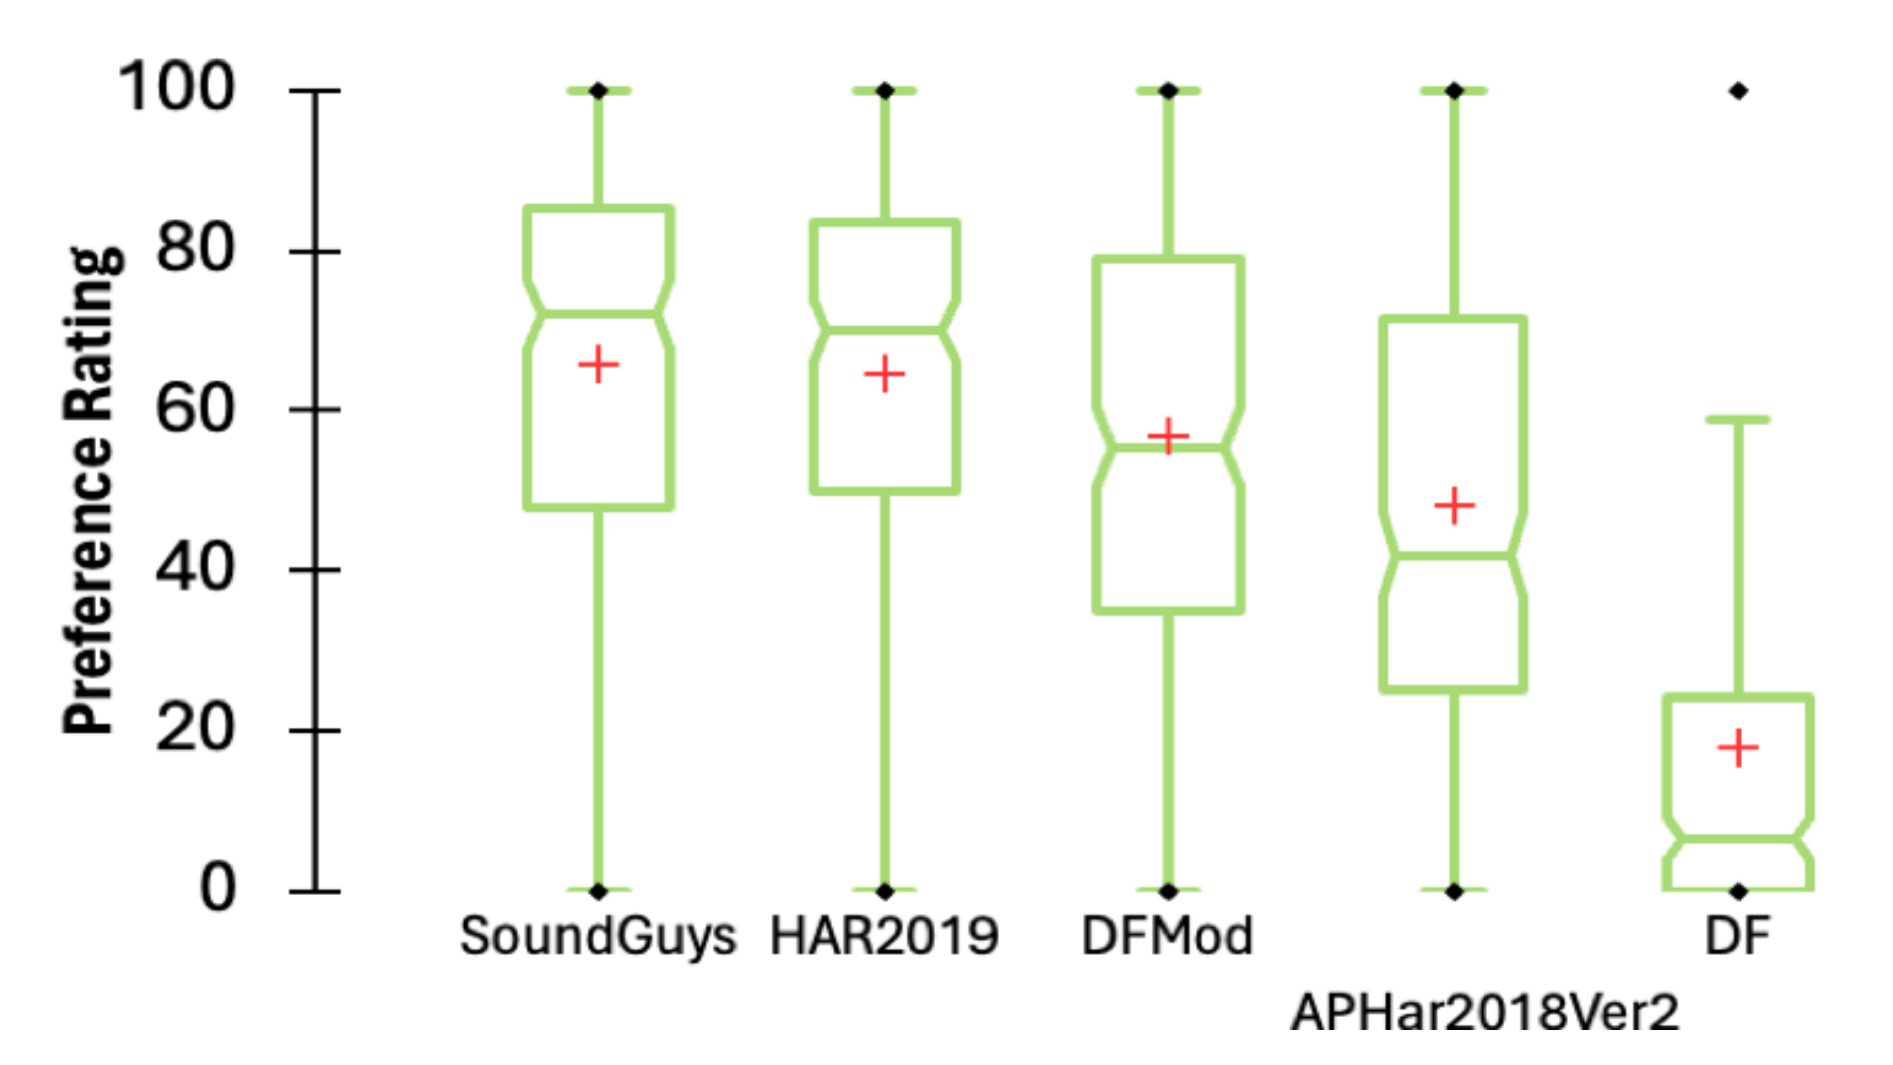
As a result of these studies, we’re now confident that headphones and in-ears that meet our target curve should sound pretty good to most people. Of course, no curve will be perfect for everyone, but at least ours will give you a meaningful basis of comparison for doing your own shopping research. While at one time we considered updating our curve periodically, for the time being we have no reason to anymore.