All products featured are independently chosen by us. However, SoundGuys may receive a commission on orders placed through its retail links. See our ethics statement.
What is the Knowles Curve?
March 11, 2024
When you quantify headphone performance, there needs to be an ear involved for the result to be meaningful. When you make acoustic measurements at the eardrum of either a person or a test mannequin (aka a Head and Torso Simulator, or “HATS”), things get complicated by the additional acoustic pathways involved. What this means is that a headphone that a recording engineer might describe as having a “flat” sound doesn’t actually produce a flat magnitude frequency response at the eardrum. This is further complicated because our brains are involved in assessing what “sounds flat.”
So, if the frequency response measurement of a flat-sounding headphone isn’t flat, what does it look like? That’s the subject of some debate. Most headphone manufacturers that know what they are doing have internal definitions of how their loudspeakers, headphones, and other audio products should sound. These typically take the form of target curves. As headphone reviewers, we also have our targets for what we think sounds right to us, and we’re not the only ones.
Not every target curve reflects the preferences of large bodies of listeners. The best known, scientifically defensible ones do, specifically, the Harman Target and now the Knowles Preferred Listening Response Curve. The former has long served as the gold standard for frequency response targets in the headphone world; the latter is now starting to influence commercially available products for the first time. So what does that mean?
While the tech surrounding headphones and earphones is exploding, the more important aspect is how we’re implementing these advances. It’s fine and well to print big numbers on a specification sheet. Still, it’s another thing entirely to identify and meet your listeners’ preferences more reliably.
Editor’s note: This is the first version of this article to be published. It may be updated to clarify information and add developments.
What is the Knowles Curve?
The Knowles Preferred Listening Response Curve is a recently proposed target curve, the product of research conducted by Tom Miller and Christina Downey, specifically to address what earphones should sound in the high-frequency region to meet listeners’ preferences. The curve largely mirrors the Harman target up to 8kHz but with a boost at 16kHz with a Q of 4, as shown in the graph below.
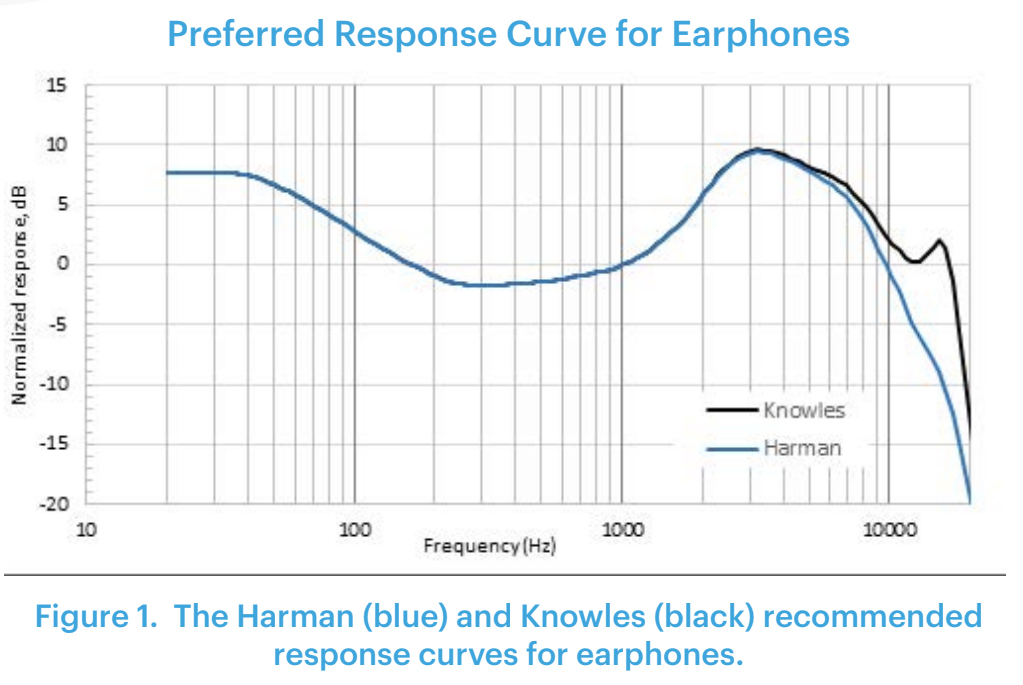
Essentially, this is modifying the upper octave that the Harman Target could not provide reasonable certainty about due to the equipment and test methods used in the original research. From 20Hz to 5kHz, the curves are identical. The deviation from the Harman Target occurs from 5kHz up, with a peak at 16kHz, before falling off considerably beyond 17kHz.
Incidentally, the same study that validated the SoundGuys Target Curve also tested versions of the Harman Target with more high-frequency content than their predecessors. Both modified targets beat their original counterparts in mean opinion scores, even if only by a little bit. So clearly, this is an area worthy of study.
Why is the Knowles Curve important?
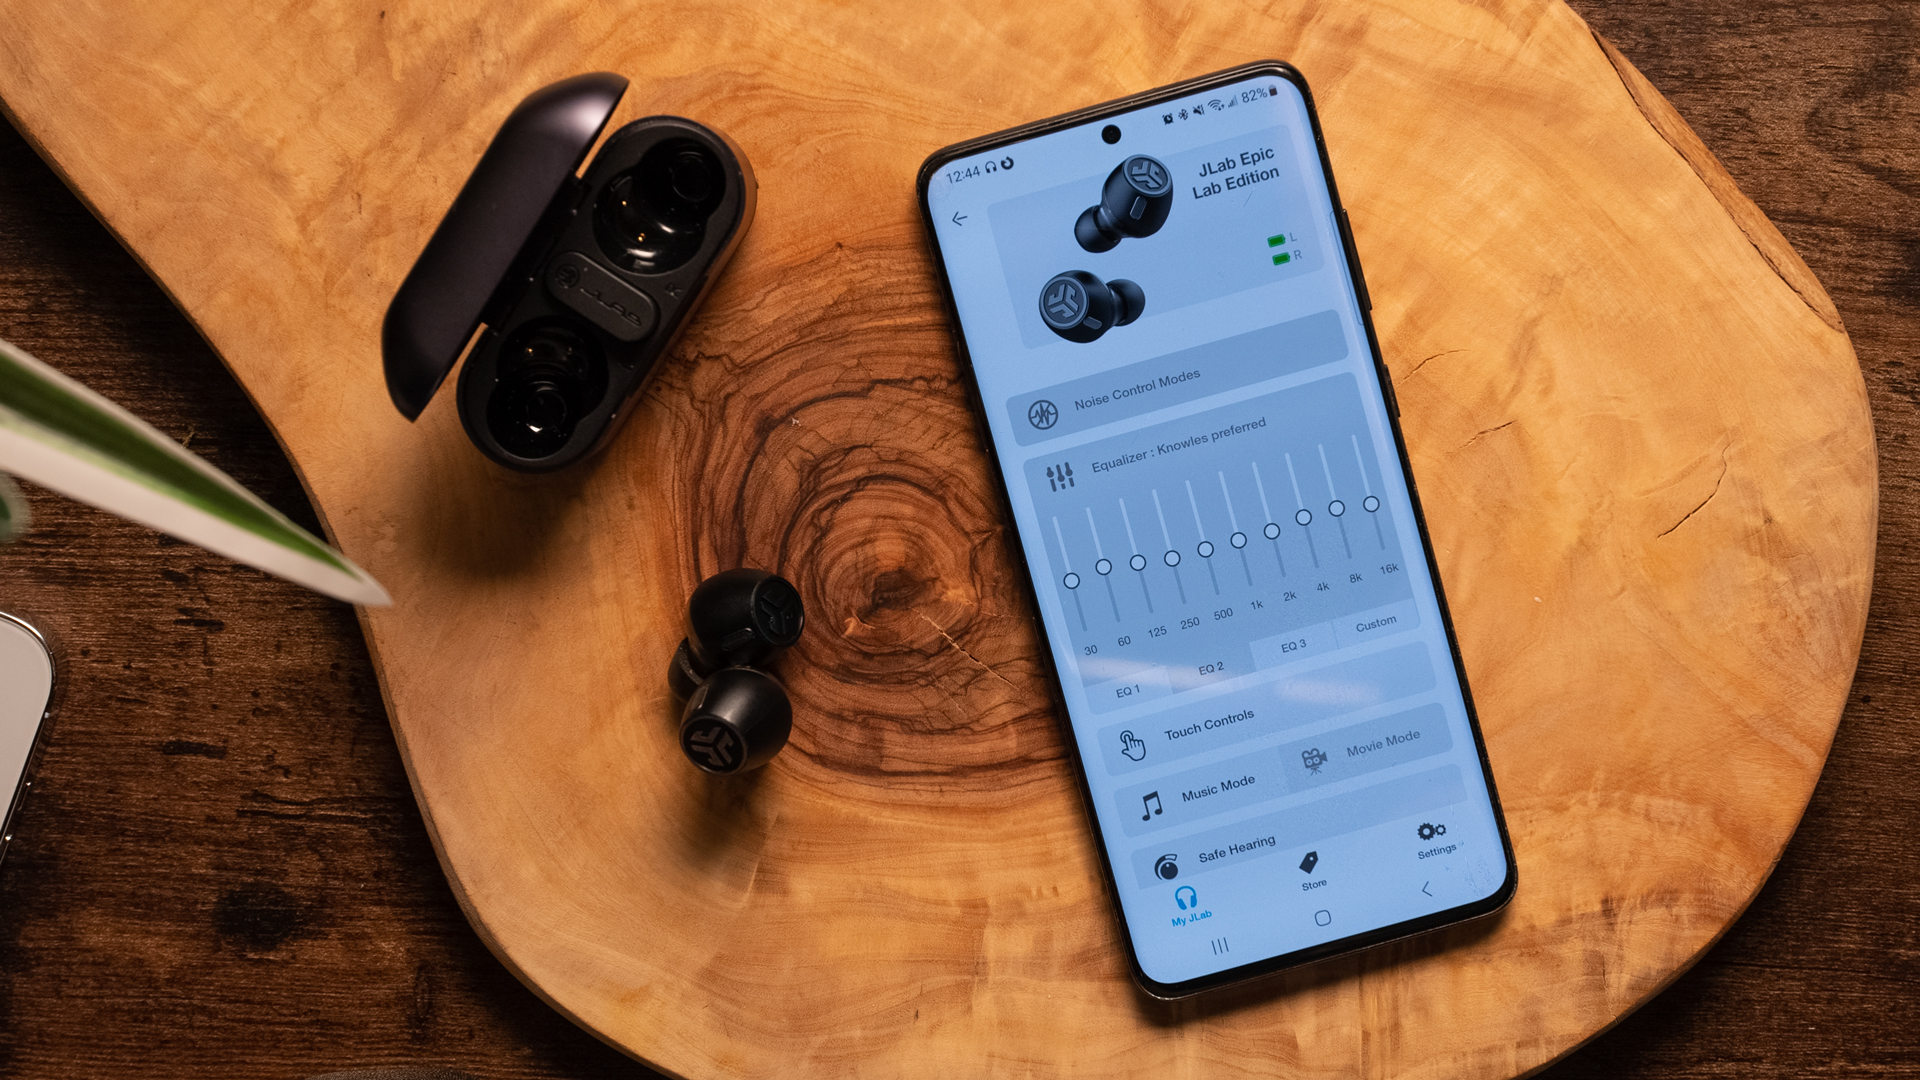
The Knowles Curve is important since it will likely be the guidepost for how earbuds that use Knowles balanced armature (BA) drivers will sound in the near future. For example, we’ve already started to see products with the latest generation of Knowles hardware and advertise compliance with the target. Your next set of earbuds may be tuned with this research in mind, whether or not you’re aware of it.
This is because Knowles is the largest manufacturer of earbud drivers on the market, and true wireless earbuds are now the most common personal audio device sold. The company’s balanced armature (BA) drivers show up in many earbuds and in-ear monitors from companies like JLab, Edifier, and Ultimate Ears, as they’ve had good results from having a dynamic driver handle the lows, and BA drivers deliver the high frequencies.
How was the curve produced?
To get this out of the way early, the term “target curve” is a bit of a misnomer. When studies produce “target” frequency response curves that describe the preferred response of their listeners, the results are not prescriptive; they’re descriptive. Consequently, you can’t just assume that anything that meets a target will automatically sound fantastic — but a large group of listeners will most often prefer equipment that can hit such a curve.
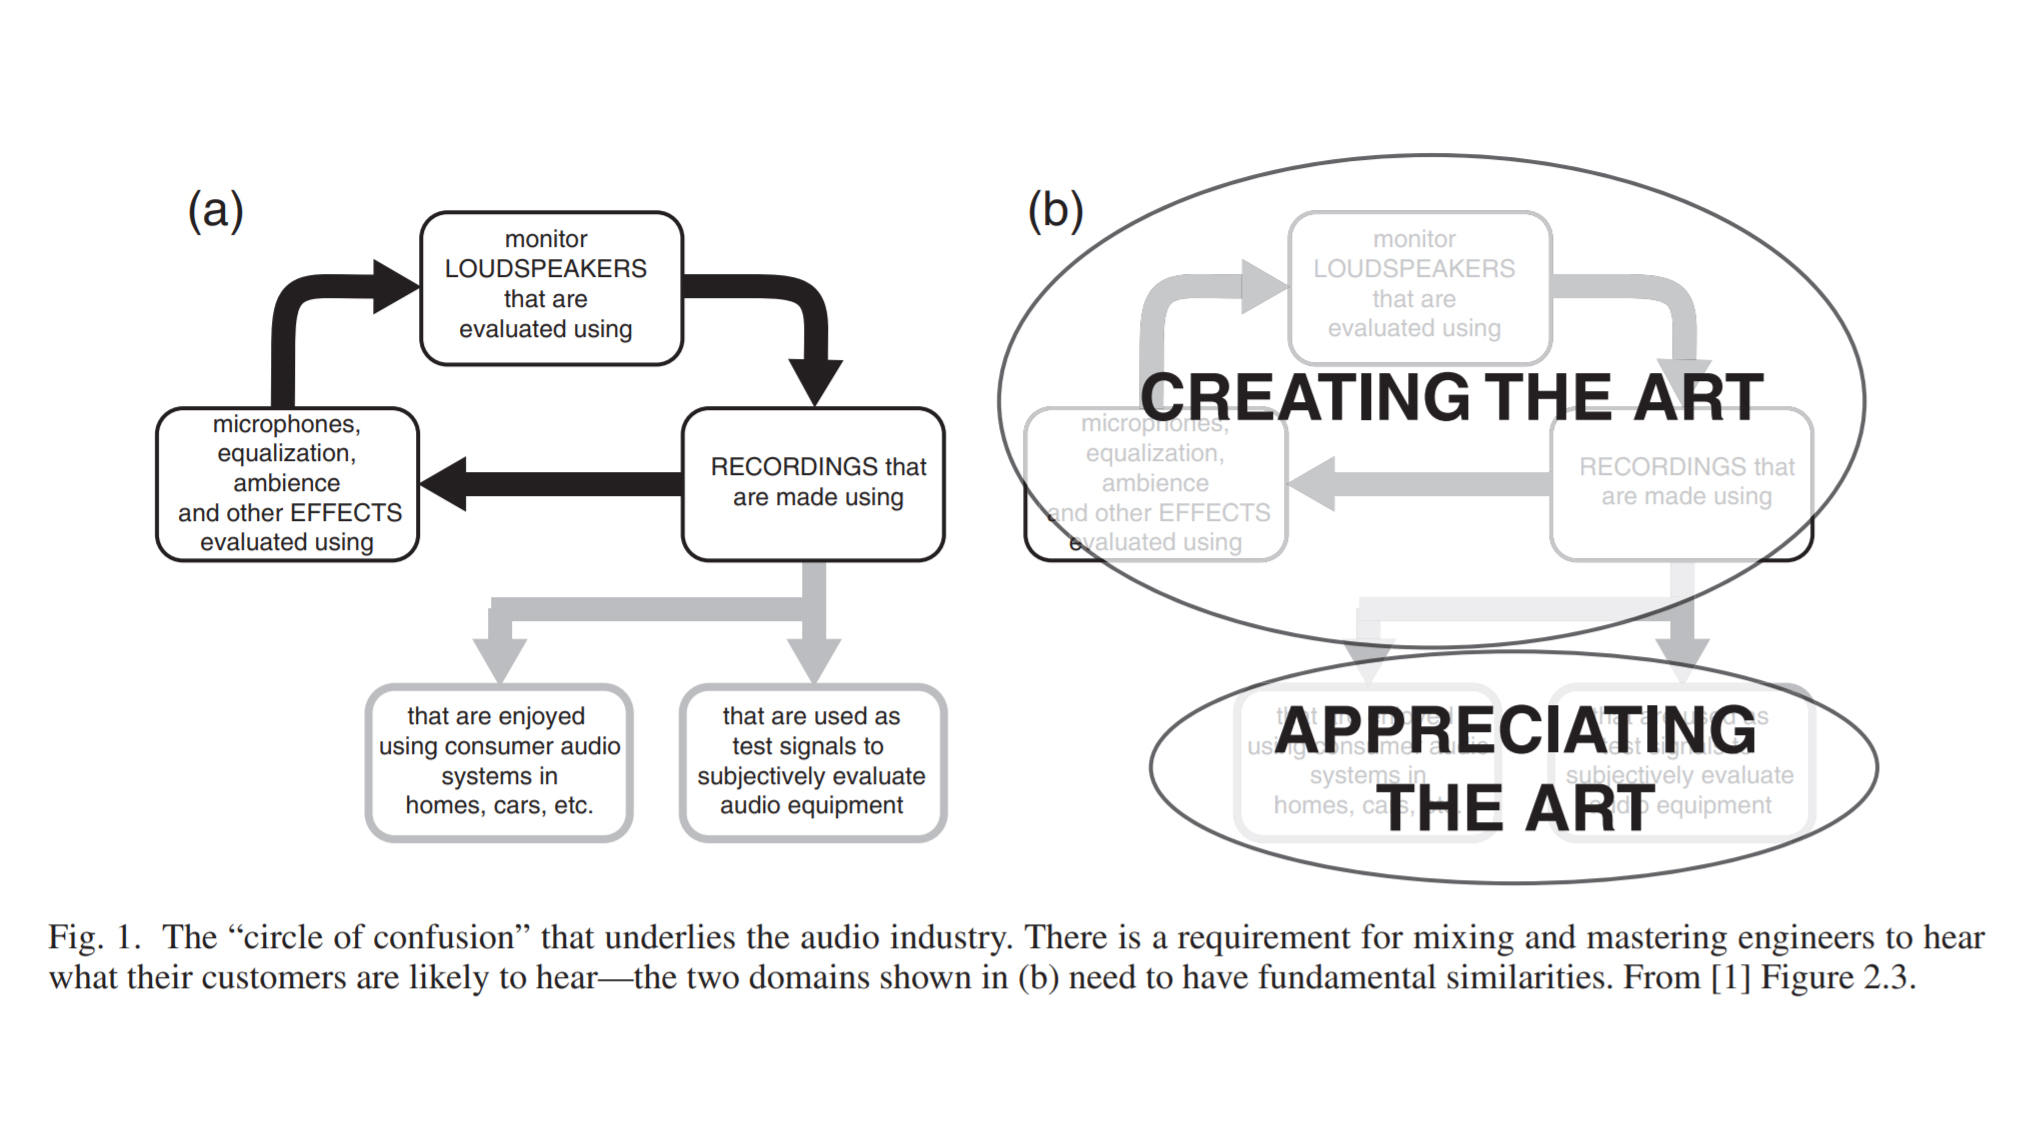
When the Harman Target was first developed, it was a game-changer in headphone design, as it was a step toward removing headphone influence from audio’s “circle of confusion.” Floyd Toole coined this term to describe the variable quality of recordings at the hands of a circular relationship between recording equipment and the devices used to monitor and listen with. The intent was to produce standardized target curves for the playback systems, which could reduce and ultimately eliminate this phenomenon. However, as the equipment to develop the Harman headphone target needed to be sufficiently accurate above 10kHz, further study was required to improve matching headphones to listener preference at those frequencies. This was the goal of the Knowles researchers.
After analyzing over 200 songs from the Billboard Hot 100 list of the last 20 years, Miller and Downey confirmed a significant amount of content above 10kHz in popular music. The researchers then set out to determine how listeners rated sound quality when this range of sound was tuned differently. It is about completing the Harman Curve with reliable measurements above 10kHz.
“We were surprised to see people wanted as much high-frequency energy as they did… people wanted their earphones to restore the music to sound like it did when they were young. We were also surprised at the large amount of individual variation in preferences. It turns out, people want earphones that can support their individual high-frequency preferences.” — Miller and Downey.
The Knowles team performed a significant number of MUSHRA (Multiple Stimuli with Hidden Reference and Anchor) controlled blind listening tests using over 200 listeners to determine which filters would sound best to the population. Listeners were presented with samples of popular music determined to be close to “average” in their spectral content and a selection of tuning filters to rate on a scale of 1-5. Exploratory data analysis could then be used to establish patterns in listener preference. You can hear more about this in Miller and Downey’s presentation, but there’s far too much to cover here.
Miller and Downey were able to zero in on their adjustments. A 16kHz peak filter with a Q of 4 was arrived at to cover two issues. First, a shelf filter would consume too much headroom in testing, and second, a lower center frequency than 16kHz would affect the verified part of the curve too much.
When we talk about equalization, “Q” is short for the “quality” of the filter. The numeric value you often see next to “Q” is a ratio of the center frequency to bandwidth. In layperson’s terms, the higher the Q value, the narrower and steeper the adjustment is. The lower the Q value, the broader and more gradual the adjustment is.
The study revealed that when you average the results of each age range, the level of high-frequency emphasis needs to be increased significantly to meet each listener group’s needs. Listeners preferred between 12 and 21 dB of gain at 16kHz over the previous assumption, roughly corresponding to their age cohort. Intuitively, your high-frequency hearing loss level will determine how much emphasis you’ll prefer.
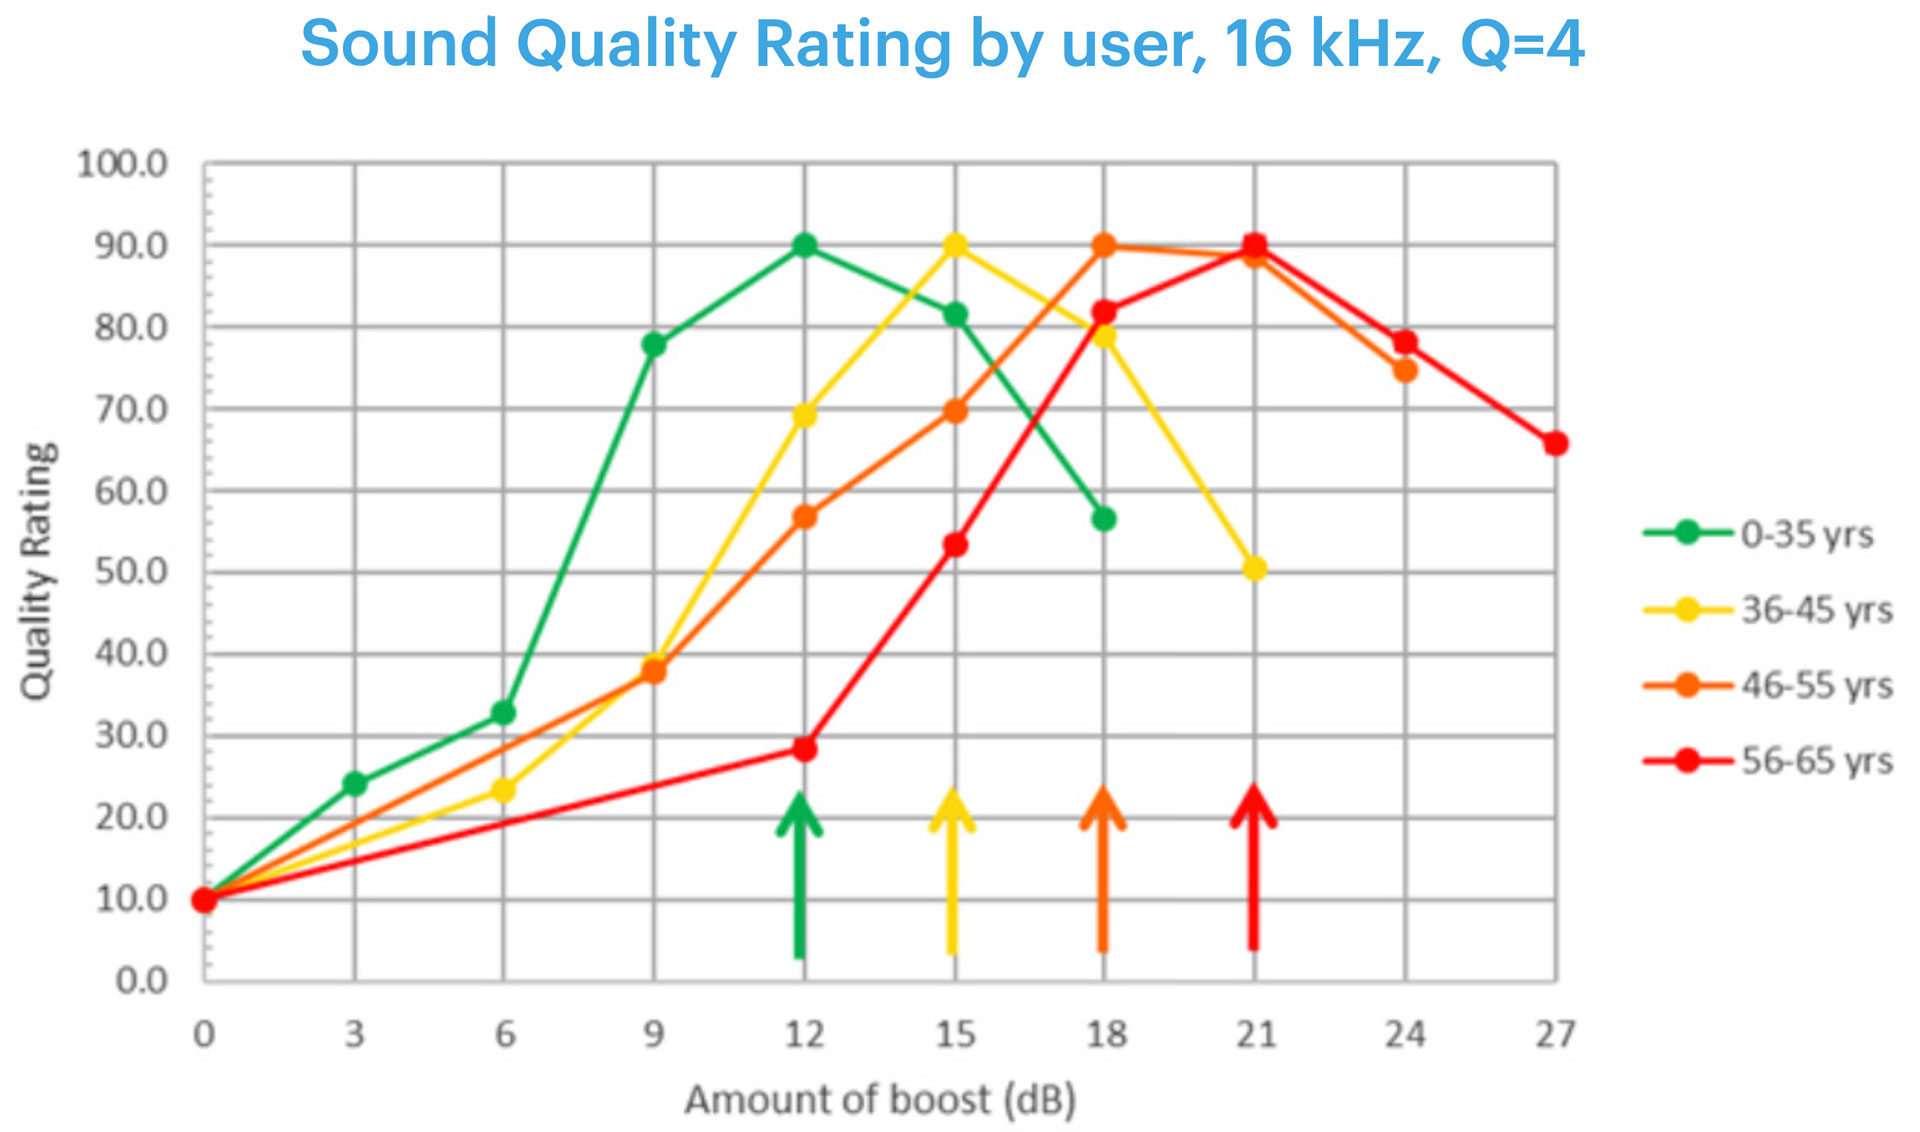
And here’s where we get to the sticky bit with choosing a house curve: you’ve identified that listeners will have wildly different preferences, and how — what do you do now? The researchers used the 0-35 version of the Knowles Curve for the mass market assumption.
Potential issues
Because the difference of the Knowles Curve is in its high-frequency emphasis, several known issues with how we hear can affect things.
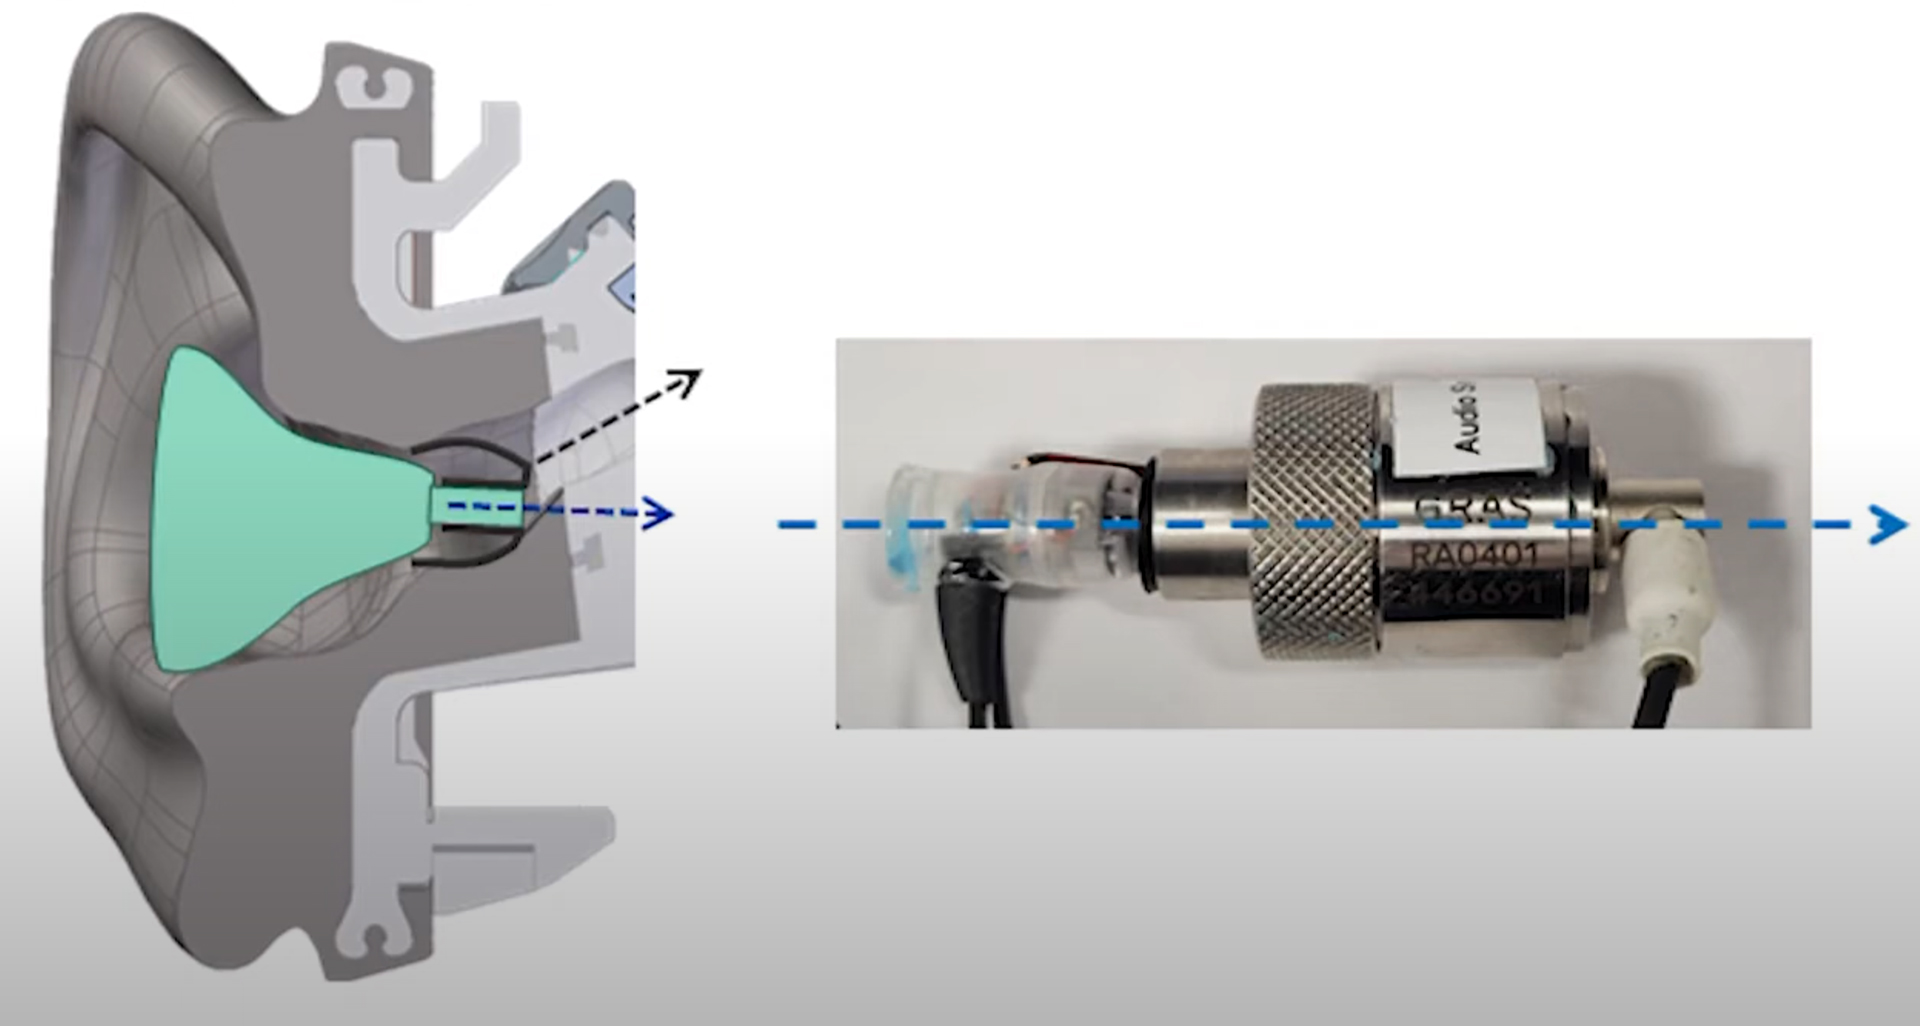
They are highly susceptible to high-frequency attenuation because the fit is inconsistent from earbud to earbud. It’s entirely possible that a Knowles-tuned earphone won’t perform as it’s supposed to if the earphone’s nozzle doesn’t sit at the correct angle in your ear canal. While Miller and Downey avoided this complication by using a funnel-shaped coupler and a microphone to detect leakage for their experiments, our ears don’t have this self-check — so you might find that earphones that should sound very similar to each other will be quite different because of the shape of your outer ear.
Loading chart ...
We measured the KN-2 (the non-commercial Knowles Curve hardware reference implementation) and the JLab Epic Lab Edition (the first commercial product that advertises Knowles compliance) on our Bruel & Kjaer 5128 test head. As you can see, these two implementations measure quite differently on our equipment.
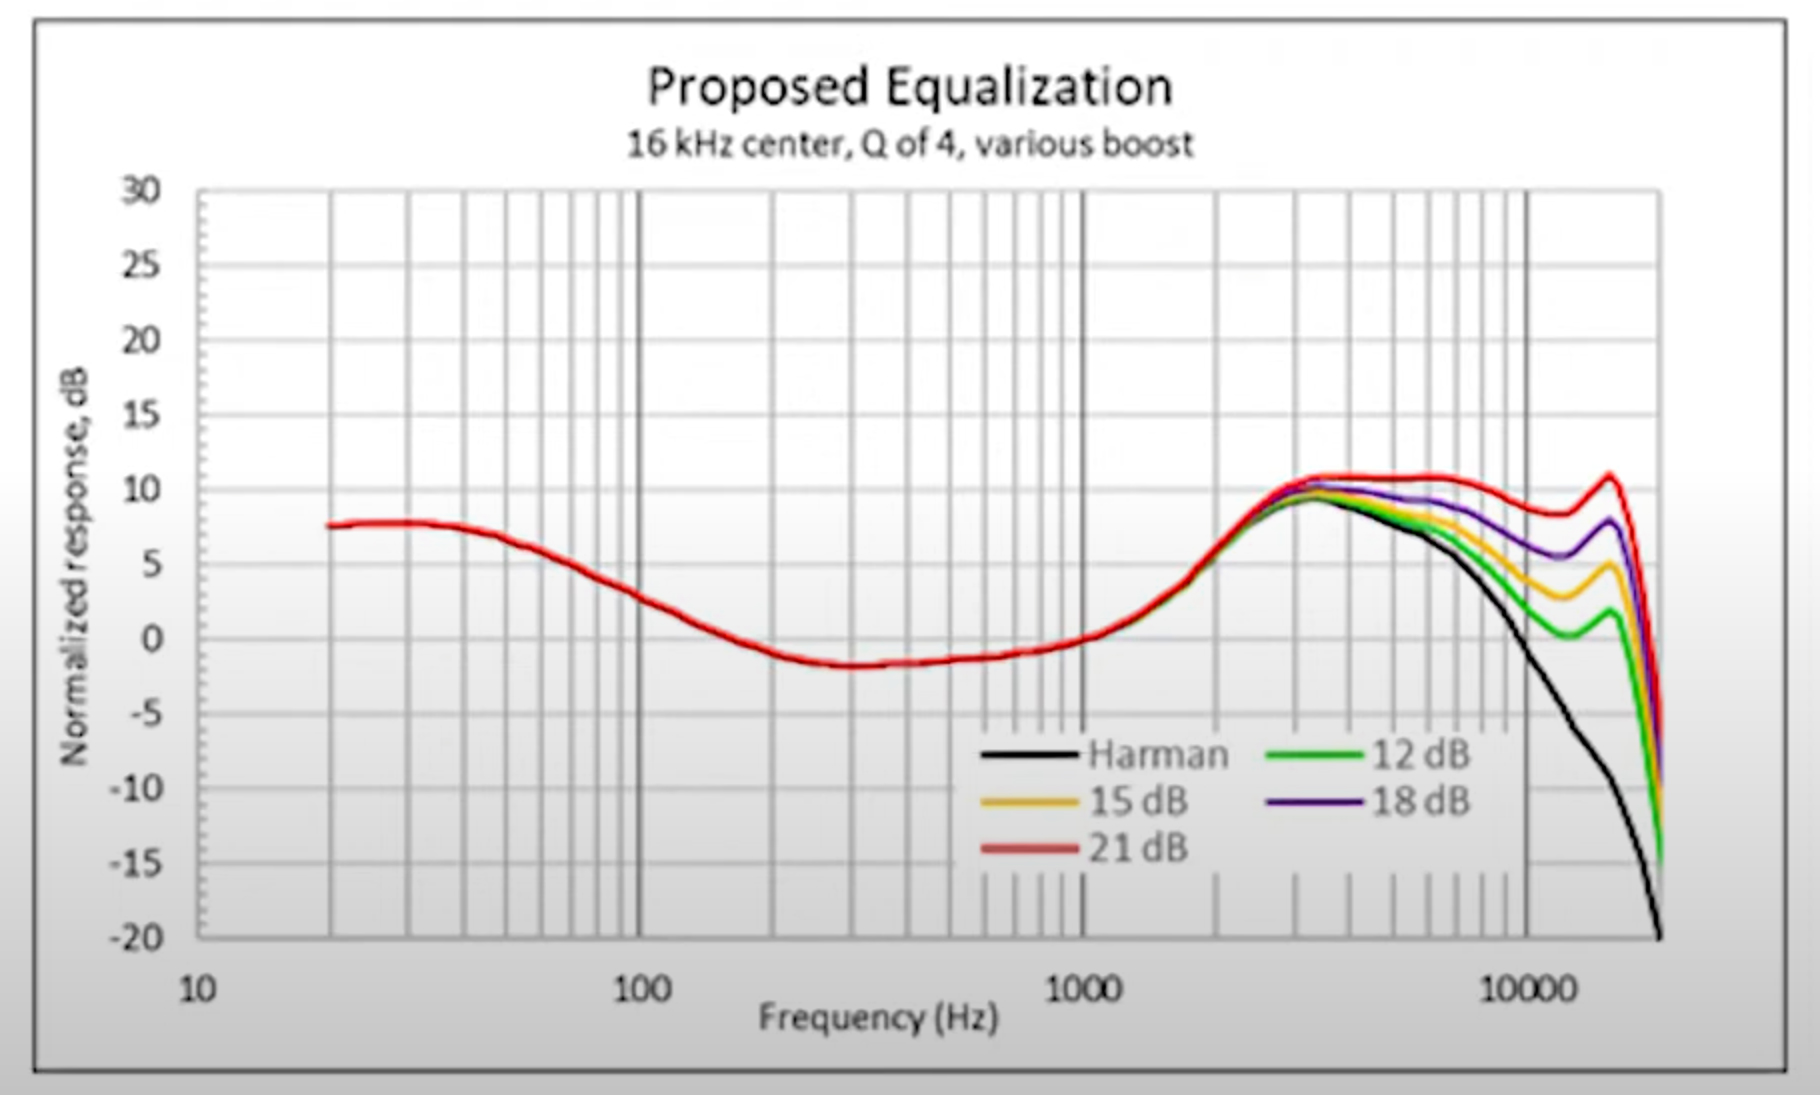
Though a target curve can guide a larger population, it does not need to meet the needs of every user. To this end, the research underpinning the Knowles Curve identified several other candidate curves for people of different ages and hearing abilities. It also reflects which curve you prefer might be a moving target over time as your high-frequency hearing loss increases with age.
Is the Knowles Curve any good?
Whether or not the Knowles Curve gets widely adopted will likely depend on how well the models that conform to it are received. There’s also the complication of yet another standard potentially adding to audio’s circle of confusion.
Interestingly, the modifications to the Harman Target that the Knowles research posits would make this highest octave more closely resemble the free field response (FFR) in this range. While it’s not exactly controversial to state that headphones should sound like good speakers in a semi-reflective room (rather than a diffuse field), it always piques our interest when another data point confirming this idea appears in a study.
So far, the positive impressions of earphones tuned to the Knowles Curve I’ve read are all from authors older than me — and I’m rounding out the last days of my thirties here. Consequently, we’re all firmly within the range of hearing loss that would be more pronounced than the 0-35 group, and what we like may not be what others like.
Should there be another study that seeks to replicate the findings of Miller and Downey, we’ll update here with those results. Until then, we’ll continue to watch how the market responds to products offering the Knowles tuning.