All products featured are independently chosen by us. However, SoundGuys may receive a commission on orders placed through its retail links. See our ethics statement.
1 / 11
In their words
@soft_willow_90 · Owner-reported
Owned 1–2 years · Still using it: yes, daily · Posted
The form factor of the case is larger than you'd expect, but not to the point of being cumbersome. Overall, they're a great standard for non-airpods.
Battery · better than expected
Would buy again
Own it? Your review joins these
Three answers, four quick reads, one sentence nobody tells you before buying · About 2 minutes · No account needed · Photo optional
Beats Studio Buds+SoundGuys Headphone Preference Curve
Tap the chart to read values
Measured frequency response (dB relative) against the SoundGuys Headphone Preference Curve. When the measurement goes above the dashed line, that frequency is louder than our preference curve, and when it goes below: it's quieter. Use the curve for comparison purposes only, as your taste may vary.
Beats Studio Buds+: frequency response, as measured in the SoundGuys lab. Frequency in hertz.
Frequency (Hz)
Response (dB)
20
3.1
25
4.9
32
5.2
40
5.1
50
4.7
63
3.6
80
2.0
100
0.3
125
-1.6
160
-3.4
200
-4.4
250
-4.9
315
-5.3
400
-5.6
500
-5.5
630
-3.1
800
-1.3
1000
0.1
1250
2.4
1600
4.4
2000
6.0
2500
8.3
3150
7.2
4000
4.4
5000
4.1
6300
1.4
8000
3.5
10000
-3.8
12500
5.2
16000
-7.5
20000
-34.3
Beats Studio Buds+
Tap the chart to read values
Passive isolation (dB) with ANC off — how much ambient noise the fit blocks on its own. Higher on the chart means more attenuation.
Beats Studio Buds+: passive isolation, as measured in the SoundGuys lab. Frequency in hertz.
Frequency (Hz)
Attenuation (dB)
21
-1.2
26
-1.5
33
3.9
41
4.4
52
5.0
65
5.8
82
5.8
103
6.0
130
5.3
163
5.8
205
6.7
259
10.3
325
10.2
410
9.6
516
8.9
613
9.8
772
18.6
972
16.1
1220
18.8
1540
21.0
1940
24.0
2440
29.1
3070
31.9
3870
23.7
4870
18.3
6130
19.6
7720
31.9
9720
32.2
12200
30.5
15400
35.5
19400
36.6
Beats Studio Buds+
Tap the chart to read values
Total attenuation (dB) with ANC on — passive isolation plus active noise cancelling. Higher on the chart means more attenuation.
Beats Studio Buds+: noise cancelling, as measured in the SoundGuys lab. Frequency in hertz.
Frequency (Hz)
Total attenuation (dB)
21
-0.9
26
4.1
33
10.0
41
13.8
52
17.8
65
23.6
82
28.2
103
27.7
130
21.5
163
22.9
205
21.5
259
25.3
325
21.6
410
17.5
516
16.9
613
18.0
772
23.2
972
21.3
1220
24.9
1540
27.4
1940
31.6
2440
30.1
3070
30.3
3870
22.9
4870
19.2
6130
23.0
7720
24.1
9720
28.6
12200
30.9
15400
37.5
19400
37.0
Beats Studio Buds+
4.9
Timbre
3.2
Distortion
3.7
Immersiveness
4.8
Overall
Multi-Dimensional Audio Quality Scores (1–5), modeled from the measured response. Higher is better across timbre, distortion, and immersiveness — add other models to see where this one lands.
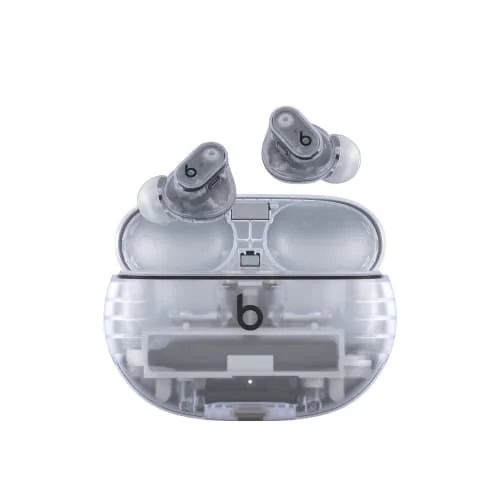
The Beats Studio Buds Plus are a competent, if slightly understated true wireless option for those who don't want the AirPods Pro. Though expensive, the buds seem to tick most of the boxes the average user may have, but no wireless charging and no equalizer mean power users will have less to gush about.
✓Liked: Battery life, USB-C fast charge, Portability, Platform compatibility
✕Could be better: Limited app function, Price, Physical buttons
What a reader who owns the Beats Studio Buds+ reports after living with it. Owner-reported, checked before publishing; ordered photo-verified first, then newest.
Owner reviews are not paid for, not solicited from specific owners, and not edited by us. The commission SoundGuys may earn on this page comes from retail links, never from owner reviews.
1 owner review
Every author writes under a generated pseudonym. A signed-in author’s email is never shown. Read more · The reader says they own it. We have not seen proof, and we say so — no label here is proof of a purchase. Read more · Owned 1–2 years · Still using it: yes, daily · Posted
Would buy again
The form factor of the case is larger than you'd expect, but not to the point of being cumbersome. Overall, they're a great standard for non-airpods.