All products featured are independently chosen by us. However, SoundGuys may receive a commission on orders placed through its retail links. See our ethics statement.


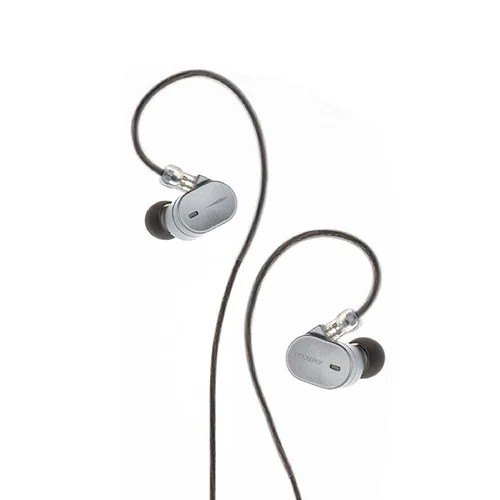
Boasting awesome acoustic isolation, these are a mainstay in pro audio circles.
MDAQS Overall — measured in the SoundGuys lab.
No one has reported on this pair yet.
Be the first. We ask a few quick questions about living with it, then check the note before publishing.
Own the Shure SE215 PRO?
Be the first owner to write in — three answers, four quick reads, shown under a pseudonym.
Plastic appears on 24% of the 50 in-ear monitors we've cataloged (of 39).
Wired-3.5mm is the most common — on 95% of the 38 in-ear monitors we've cataloged (of 39).
Memory foam is the most common — on 21% of the 53 in-ear monitors we've cataloged (of 39).
False is the most common — on 69% of the 35 in-ear monitors we've cataloged (of 39).
Objective measurements from the SoundGuys test lab — overlay other models to see how this one compares.
Measured frequency response (dB relative) against the SoundGuys Headphone Preference Curve. When the measurement goes above the dashed line, that frequency is louder than our preference curve, and when it goes below: it's quieter. Use the curve for comparison purposes only, as your taste may vary.
| Frequency (Hz) | Response (dB) |
|---|---|
| 20 | 3.1 |
| 25 | 3.5 |
| 32 | 3.7 |
| 40 | 3.8 |
| 50 | 3.8 |
| 63 | 3.6 |
| 80 | 3.4 |
| 100 | 3.0 |
| 125 | 2.4 |
| 160 | 1.7 |
| 200 | 0.9 |
| 250 | 0.5 |
| 315 | 0.2 |
| 400 | -0.8 |
| 500 | -1.8 |
| 630 | -1.4 |
| 800 | -1.0 |
| 1000 | 0.1 |
| 1250 | 1.6 |
| 1600 | 4.3 |
| 2000 | 7.1 |
| 2500 | 8.3 |
| 3150 | 6.0 |
| 4000 | 6.2 |
| 5000 | 10.7 |
| 6300 | 0.9 |
| 8000 | 0.2 |
| 10000 | -2.8 |
| 12500 | -6.1 |
| 16000 | -11.7 |
| 20000 | -36.2 |
Passive isolation (dB) with ANC off — how much ambient noise the fit blocks on its own. Higher on the chart means more attenuation.
| Frequency (Hz) | Attenuation (dB) |
|---|---|
| 21 | 12.3 |
| 26 | 12.8 |
| 33 | 12.6 |
| 41 | 12.3 |
| 52 | 12.7 |
| 65 | 12.9 |
| 82 | 13.2 |
| 103 | 14.2 |
| 130 | 9.4 |
| 163 | 13.4 |
| 205 | 12.3 |
| 259 | 10.0 |
| 325 | 10.5 |
| 410 | 17.1 |
| 516 | 12.6 |
| 613 | 14.5 |
| 772 | 23.6 |
| 972 | 23.4 |
| 1220 | 29.2 |
| 1540 | 32.3 |
| 1940 | 38.2 |
| 2440 | 41.6 |
| 3070 | 45.3 |
| 3870 | 44.0 |
| 4870 | 42.6 |
| 6130 | 43.1 |
| 7720 | 49.8 |
| 9720 | 44.0 |
| 12200 | 37.4 |
| 15400 | 39.3 |
| 19400 | 47.8 |
Multi-Dimensional Audio Quality Scores (1–5), modeled from the measured response. Higher is better across timbre, distortion, and immersiveness — add other models to see where this one lands.
The verdict
The Shure SE215 sound pretty good, look the part, and isolate like a champ. You don't need any additional purchases to make them work for most applications, and they are priced competitively for what they do. While universal fit IEMs are rarely "universal," the SE215 stay put without discomfort.
✓Liked: Good frequency response profile, Great Isolation, Sturdy, removable MMCX cable, Vast ear tip selection
✕Could be better: Earbuds can stick out even if the in-ear fit is fine, Upper frequencies not well represented
Nobody who owns the Shure SE215 PRO has written in yet.
Owner notes are not paid for, not solicited from specific owners, and not edited by us. The commission SoundGuys may earn on this page comes from retail links, never from notes.
Own the Shure SE215 PRO?
Three answers, four quick reads, one sentence nobody tells you before buying. Shown under a pseudonym.
Commentary and deep dives from the SoundGuys editorial team.