All products featured are independently chosen by us. However, SoundGuys may receive a commission on orders placed through its retail links. See our ethics statement.
1 / 11
In their words
@nimble_birch_87 · Photo-verified
Owned 6–12 months · Still using it: no, stopped · Posted
The hinge design is severely flawed, and many other reviews online corroborate this. Not enough people, particularly reviewers discuss this point of failure.
Battery · better than expected
Mic on calls · worse than expected
Fit and build · worse than expected
Headband / hinge · gave out
Would not buy again
Own it? Your note joins these
Three answers, four quick reads, one sentence nobody tells you before buying · About 2 minutes · No account needed · Photo optional
Measured frequency response (dB relative) against the SoundGuys Headphone Preference Curve. When the measurement goes above the dashed line, that frequency is louder than our preference curve, and when it goes below: it's quieter. Use the curve for comparison purposes only, as your taste may vary.
Sony ULT WEAR: frequency response, as measured in the SoundGuys lab. Frequency in hertz.
Frequency (Hz)
Response (dB)
20
9.7
25
9.4
32
8.6
40
7.4
50
6.0
63
3.9
80
3.5
100
5.7
125
5.4
160
2.2
200
0.6
250
-1.2
315
-2.0
400
-1.1
500
0.8
630
1.5
800
0.4
1000
-0.0
1250
-0.1
1600
-1.6
2000
-2.6
2500
-4.0
3150
1.0
4000
3.2
5000
7.1
6300
7.0
8000
5.1
10000
-2.8
12500
-2.6
16000
-15.6
20000
-34.4
Sony ULT WEAR
Tap the chart to read values
Passive isolation (dB) with ANC off — how much ambient noise the fit blocks on its own. Higher on the chart means more attenuation.
Sony ULT WEAR: passive isolation, as measured in the SoundGuys lab. Frequency in hertz.
Frequency (Hz)
Attenuation (dB)
21
4.5
26
-0.5
33
1.2
41
1.4
52
0.7
65
1.8
82
-0.4
103
-1.8
130
2.5
163
4.1
205
7.8
259
12.0
325
14.2
410
16.6
516
21.7
613
21.9
772
24.3
972
24.0
1220
25.6
1540
24.9
1940
27.9
2440
30.2
3070
35.0
3870
33.3
4870
33.0
6130
48.7
7720
47.6
9720
43.6
12200
44.1
15400
42.1
19400
43.8
Sony ULT WEAR
Tap the chart to read values
Total attenuation (dB) with ANC on — passive isolation plus active noise cancelling. Higher on the chart means more attenuation.
Sony ULT WEAR: noise cancelling, as measured in the SoundGuys lab. Frequency in hertz.
Frequency (Hz)
Total attenuation (dB)
21
9.6
26
11.9
33
14.3
41
15.7
52
17.9
65
20.2
82
26.9
103
24.4
130
24.0
163
25.2
205
23.7
259
23.4
325
23.7
410
25.7
516
24.3
613
24.1
772
24.4
972
26.0
1220
23.6
1540
24.5
1940
26.0
2440
26.1
3070
27.2
3870
35.4
4870
30.9
6130
37.4
7720
31.5
9720
37.9
12200
41.5
15400
39.7
19400
43.3
Sony ULT WEAR
4.0
Timbre
3.7
Distortion
4.8
Immersiveness
4.0
Overall
Multi-Dimensional Audio Quality Scores (1–5), modeled from the measured response. Higher is better across timbre, distortion, and immersiveness — add other models to see where this one lands.
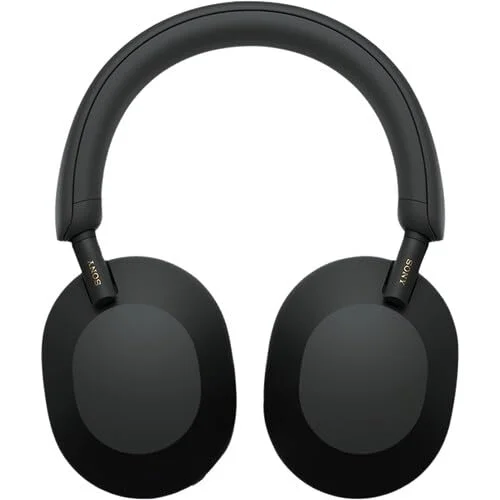
Though Sony is well-known for making fan-favorite headphones, the Sony ULT WEAR goes too far with its bass. It's possible this will change in an update, but at launch the sound quality isn't where it needs to be.
What a reader who owns the Sony ULT WEAR reports after living with it. Owner-reported, checked before publishing; ordered photo-verified first, then newest.
Owner notes are not paid for, not solicited from specific owners, and not edited by us. The commission SoundGuys may earn on this page comes from retail links, never from notes.
1 owner note
Every author writes under a generated pseudonym. A signed-in author’s email is never shown. Read more · A moderator saw a photo of this reader’s unit and it matched the product. Proof of possession, not purchase — and the photo was deleted after the check. Read more · Owned 6–12 months · Still using it: no, stopped · Posted
Would not buy again
The hinge design is severely flawed, and many other reviews online corroborate this. Not enough people, particularly reviewers discuss this point of failure.