All products featured are independently chosen by us. However, SoundGuys may receive a commission on orders placed through its retail links. See our ethics statement.
RTINGS.com adds SoundGuys curves to headphone comparisons
April 29, 2025

- RTINGS.com now allows users to select from verified target and preference curves in its headphone comparison tool.
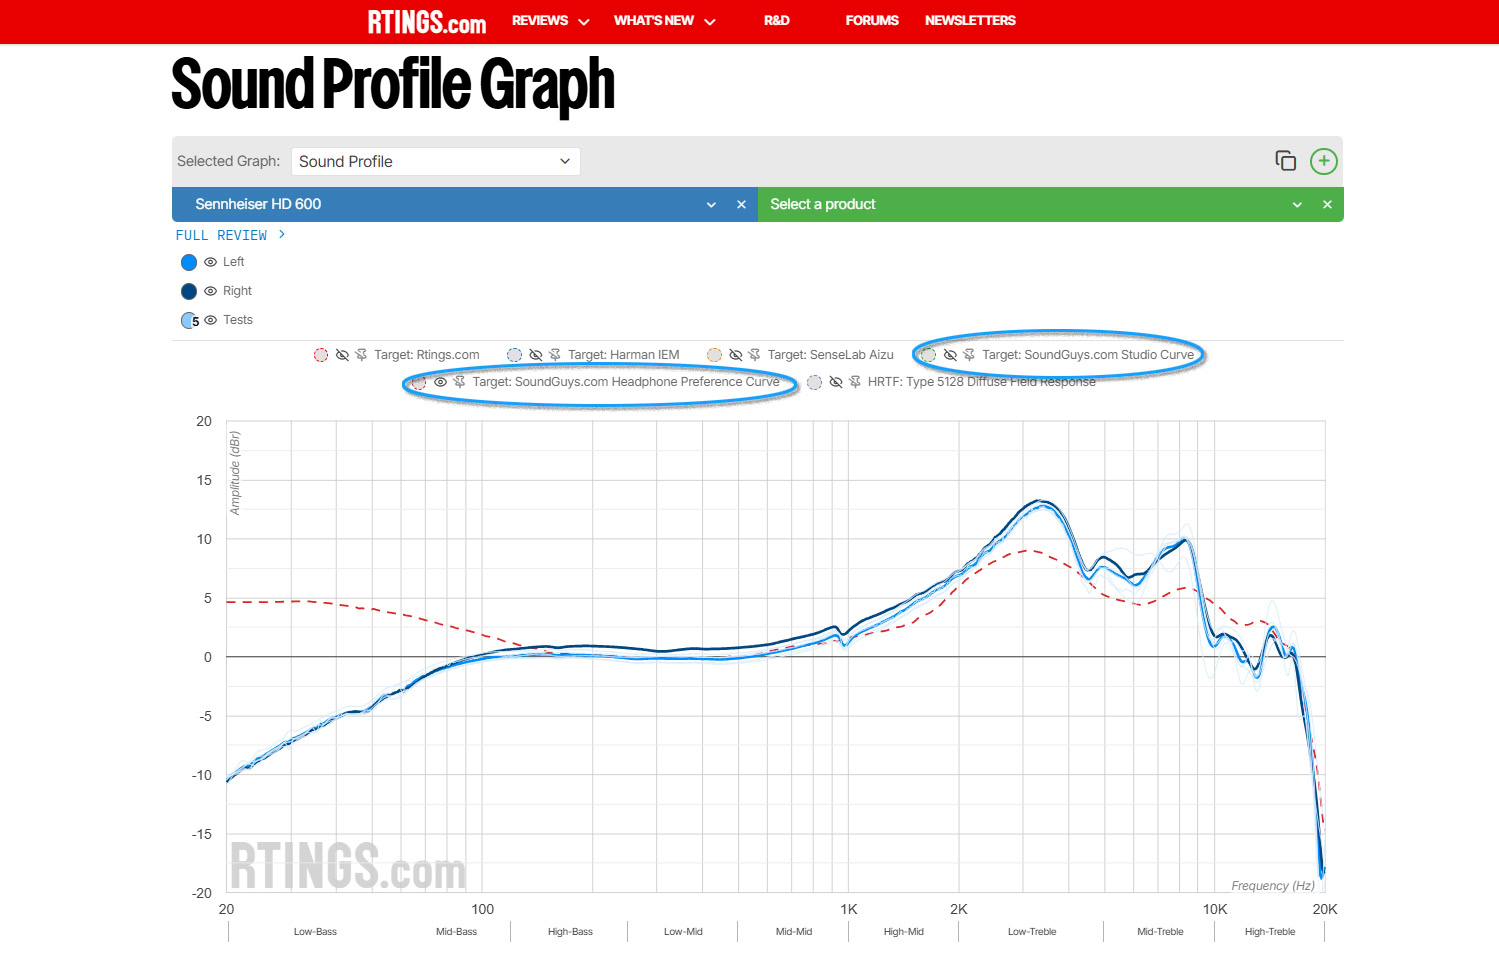
- Among the available curves are the SoundGuys Headphone Preference Curve and the SoundGuys Studio Curve.
- Headphone enthusiasts can now compare official measurements from multiple sources against our curves.
As of April 25, 2025, users of RTINGS.com can now compare the outlet’s measurements against the SoundGuys Headphone Preference Curve, as well as the SoundGuys Studio Curve. In an agreement between the sites, SoundGuys agreed to provide RTINGS.com with its validated Headphone Preference Curve, and Studio Curve for use in the product review site’s headphone comparison tool. As both SoundGuys and RTINGS.com use the Bruel & Kjaer 5128 measurement fixture, both sites generate data compatible with the preference curves.

RTINGS also added the Harman IE 2019 Target, the Senselab/Aizu Curve, and its own target curve for users to be able to select and compare data to. This allows readers to pick and choose which target that aligns with their preferences more closely. Select the eyeball icon next to the title to show the trace on the graph area, or the pin icon to normalize the data to that curve.
The Test Bench 2.0 changelog article on RTINGS.com’s website is available as of publication. It provides more detail about the site’s publishing philosophy regarding measurements, preference curves, and other topics.
Why this matters
A note on target curves
Many people seem to miss the forest for the trees when discussing these tools, as they often use these curves to predict their own preferences when that may be inappropriate. In his previous presentations, Dr. Sean Olive discusses vital prior assumptions to approaching preference (or “target”) curves:
- Headphones can have similar predicted preference scores and sound very different.
- Models based solely on frequency response do not account for nonlinear distortion or spatial effects.
- Models based on target curves don’t account for your personal tastes, hearing loss, or … your own biology.
- A target curve is a guideline for comparing headphone responses.
While no one curve will satisfy every listener, using one that describes your preferences is a helpful way to compare measurements as a guideline. With these foundational assumptions in mind, you should now have the appropriate amount of chill when discussing the concept with others.
The change makes both SoundGuys’ and RTINGS.com’s test measurements more valuable, as they can now be compared more meaningfully — even if they aren’t completely the same. For example: by reading both sites, you can use both SoundGuys’ measurements and RTINGS.com’s to get a better idea of inter-unit variation, what a different level may sound like, what a different fit might look like, and so on. This also opens the door to gut-checking our work against each other more rapidly. This is good news for headphone enthusiasts; the coverage on both sites will improve as a result.
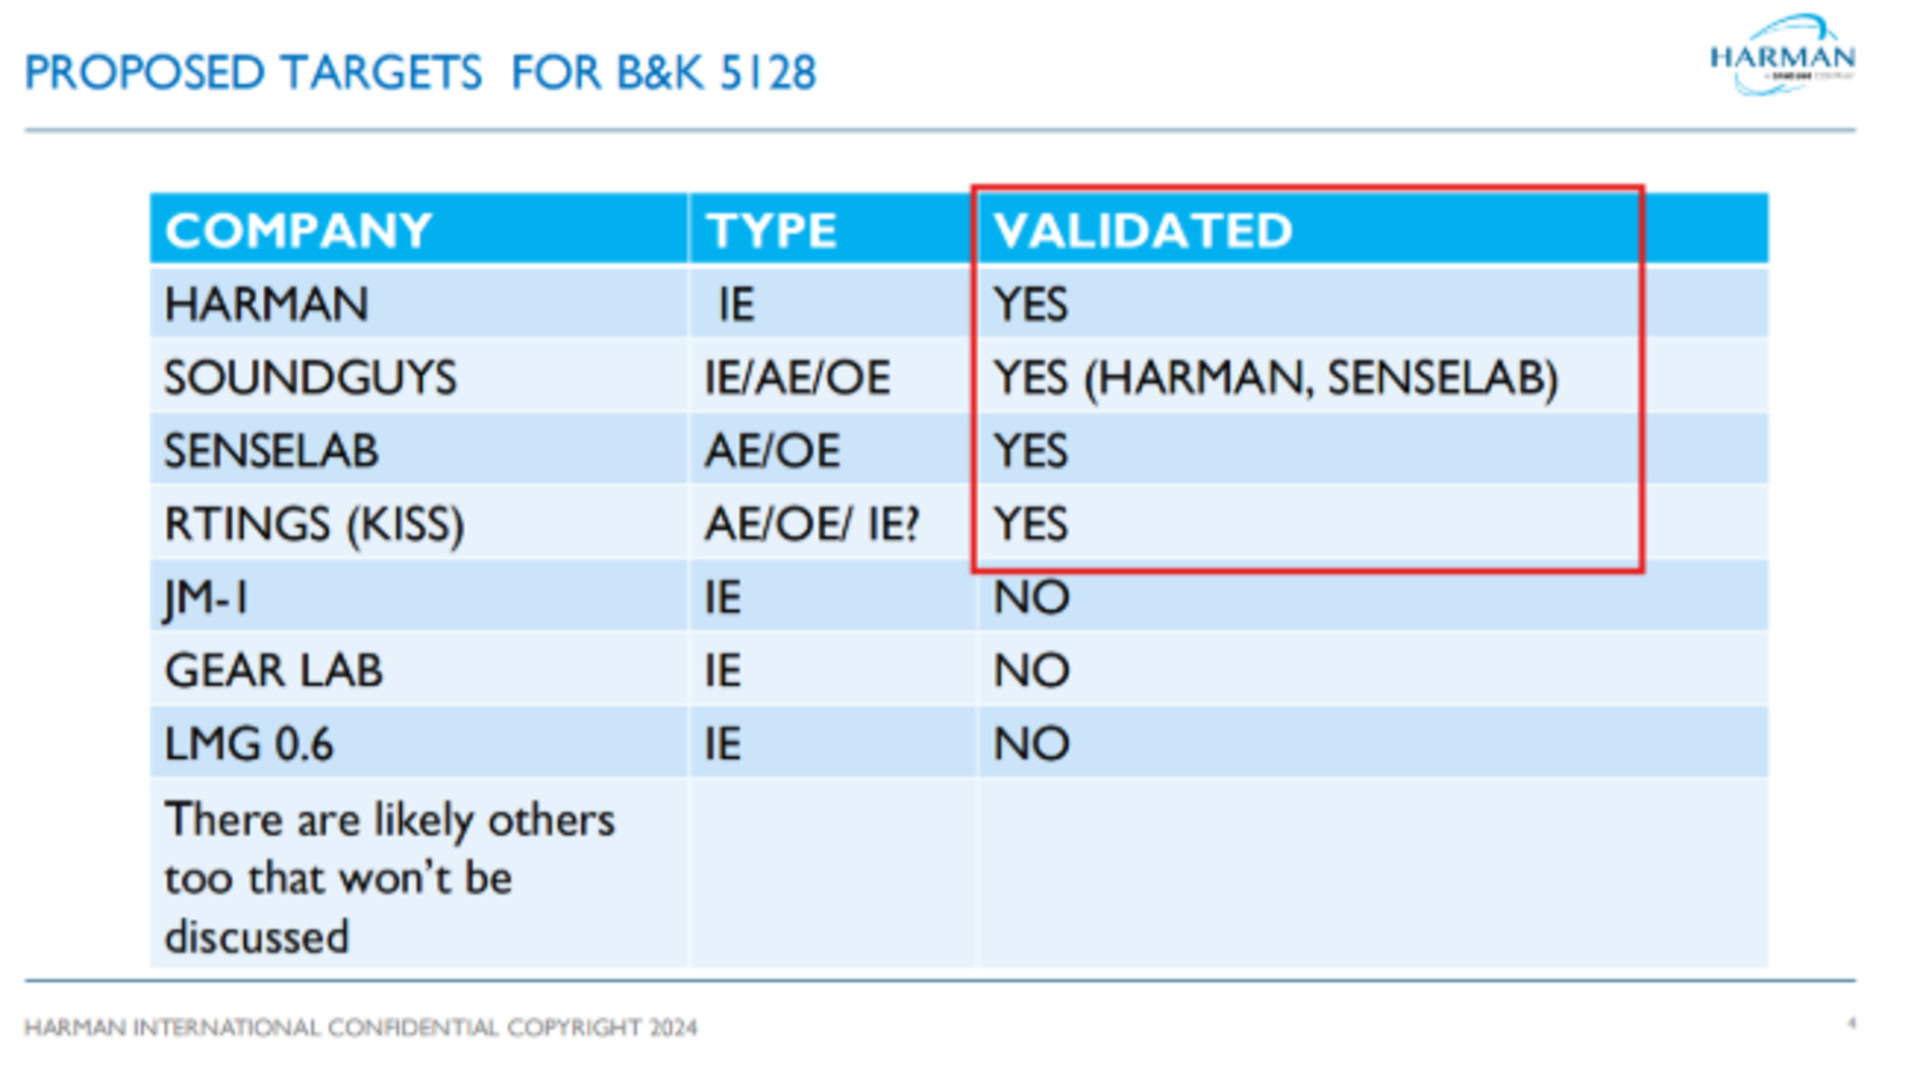
The SoundGuys Headphone Preference Curve has now been incorporated into the coverage of more than one outlet, making it one of the most visible comparison tools for interpreting headphone frequency responses in headphone reporting. As RTINGS.com and Dr. Sean Olive pointed out, the SoundGuys Headphone Preference Curve is currently the only curve to date for the Bruel & Kjaer 5128 that’s been validated for both over-ear, and in-ear measurement comparisons.

With headphones firmly within a “wild west” era when it comes to adapting to the consequences of new testing equipment and philosophies, getting a clear view of the whole landscape is sticky. There are a few validated target curves, and even more layers of complexity being explored by headphone reviewers. Though the frustration against measurements being so critical to headphone coverage has led to crude accusations of “measurebating,” we as journalists are finding more defensible ways to cover the segment due to research into listener preferences being made public. This, in turn, allows more readers to identify products they might like more quickly.
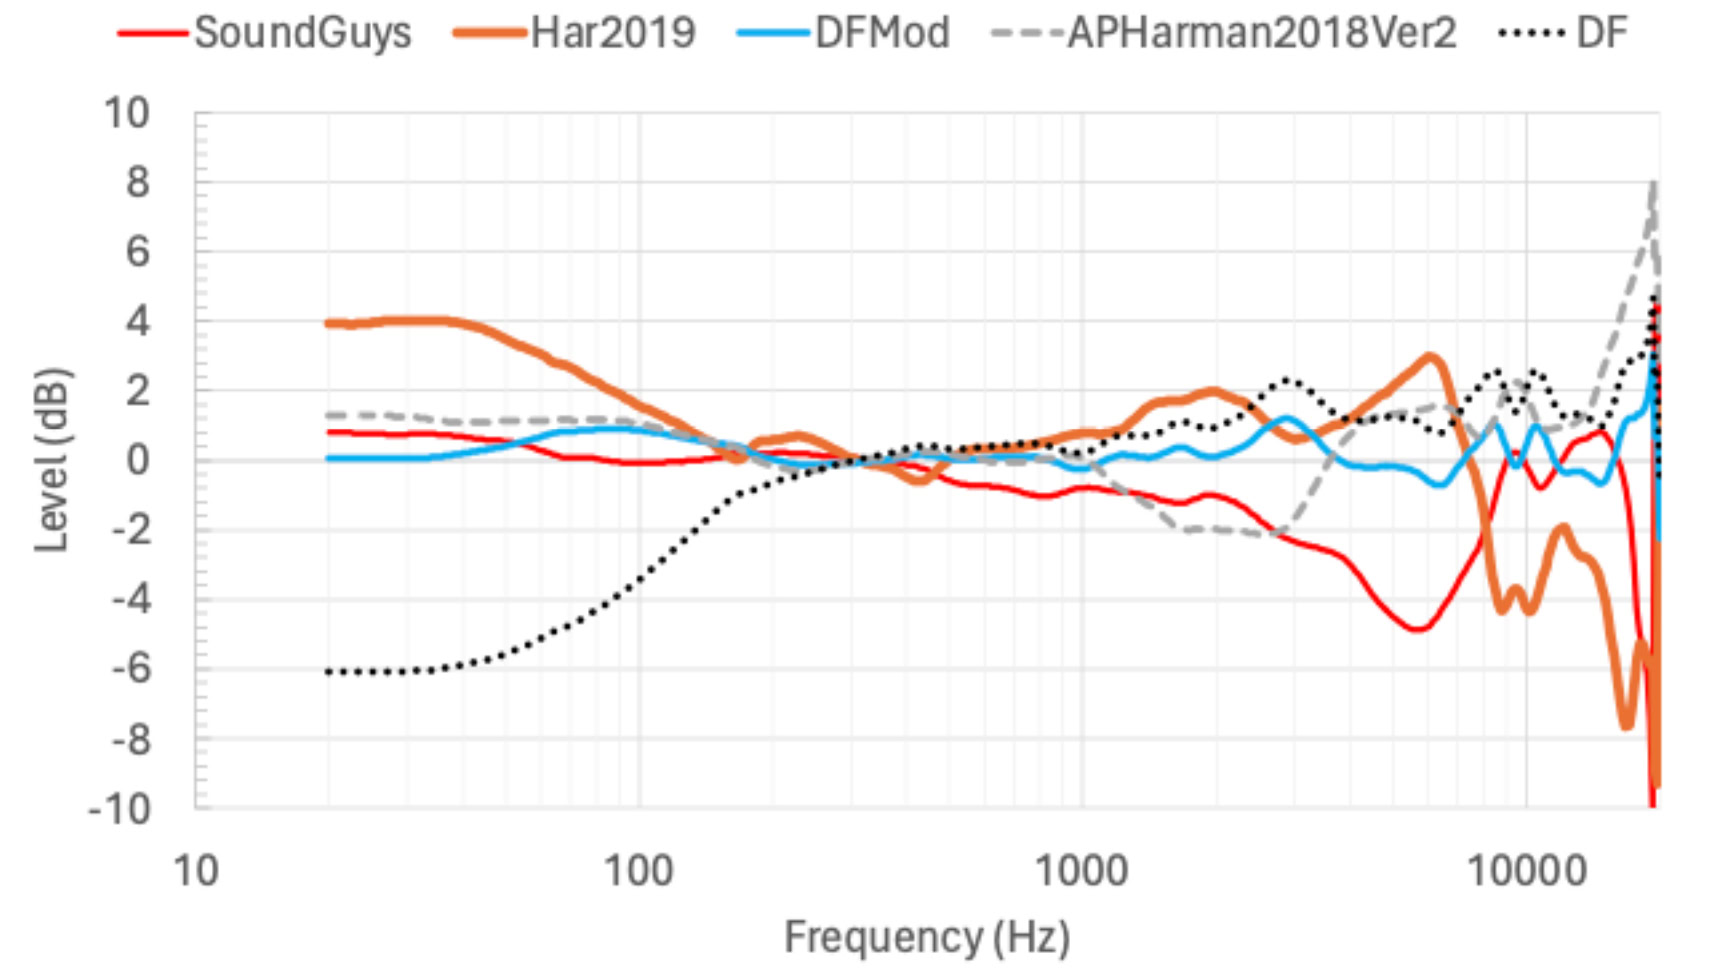
If we’ve learned anything from adopting MDAQS into our assessments, it’s that the same people can like very different things — and knocking something for merely being different isn’t very wise without context. This observation was also noted in the most recent Harman work, as the SoundGuys Headphone Preference Curve and the Harman IE 2019 Target are very different in the bass and highs, but score about the same in listener preference in the same pool of people. Adopting a tool like the one proffered by RTINGS.com is an interesting way to meet readers that understand a little more about their own preferences.
Why we shared

We agreed to share because Test Designer Pierre Lelièvre is 100% correct when he says, “Knowledge is meant to be shared, and everybody wins if we all work together.” Having a curve validated for use in assessing listener preferences isn’t very useful if it can’t be used! The headphone community wouldn’t be enjoying as much democratization of listener preference knowledge without the family of Harman Targets being made public for people to compare frequency responses to in the first place. So if journalists are to maintain ethical coverage that doesn’t benefit one headphone manufacturer over others, they can’t jealously guard theirs like Gollum every time one gets validated.
This is good news for headphone enthusiasts; the coverage on both sites will improve as a result.
While it can be fun to banter and quibble about which target curve is the “best,” there’s no ideal for everyone, so comparing measurements to different targets that a listener prefers is an interesting option for enthusiasts. It’s less geared towards meeting the novice, as headphone reviewers and those who discuss measurements need tools to convey context to people who might not have an intimate understanding of what rainbow squiggles on a chart mean. For this task, choosing a target or preference curve helps readers and reviewers anchor descriptions of sound in a meaningful baseline to compare to. In that light, the SoundGuys Headphone Preference Curve succeeds in its mission and will now do so in more places than just SoundGuys.
Thank you for being part of our community. Read our Comment Policy before posting.