All products featured are independently chosen by us. However, SoundGuys may receive a commission on orders placed through its retail links. See our ethics statement.
How to read Mean Opinion Scores
October 17, 2025
So you’re new to SoundGuys, and you’ve been exposed to a bunch of numbers showcasing a product’s sound quality. Maybe they seem a little too good, or maybe they seem a little too bad based on your experience. Are the numbers wrong? Or is there something that’s not getting through?
Several of our figures — especially Multi-Dimensional Audio Quality Scores (MDAQS) — use what’s called Mean Opinion Scores (MOS) to convey how well a product performs. But what do those mean, and how are they calculated? Let me walk you through it.
- A Mean Opinion Score is an average of many responses.
- A Mean Opinion Score is not an infallible figure for ranking products.
- Mean Opinion Scores are more certain as they approach the extremes of your range.
- Mean Opinion Scores are less certain as they approach the center of your range.
- You are a sample size of one, and you likely will disagree with other people’s scores for the same products.
What is a Mean Opinion Score?

If you need to quantify how people rate things subjectively, a great way to do this is to ask a large group of people to rate something on a Likert scale (e.g., 1-5, 1-7, or 1-10), and tally up the responses. To get a firmer idea of how a group liked something, you can then calculatethe arithmetic mean of every response to place the group’s general feedback somewhere along this scale. This is a Mean Opinion Score. This kind of data collection and analysis is used everywhere, from customer service surveys to polling to network quality testing.
To bring this back to SoundGuys, here’s the scale we use for microphone ratings:
| Mean Opinion Score | |
|---|---|
1-1.9 | Read the review (it will be funny) |
2-2.9 | Read the review for more information |
3-3.9 | Read the review for more information |
4-5 | The product sounds good (but read the review for additional information) |
Though each option is decidedly qualitative, by assigning numbers to this scale, we can more easily temperature-check a large group of people. So why are we talking about doing this in the context of headphones?
The issue with scoring headphones
Scoring headphone sound quality is damned near impossible, and I will hear no dissenters.
No matter what metric you choose, not everyone agrees on what they like — so measurements alone aren’t enough to score sound quality. So many factors can change what a person chosen at random may prefer — or even hear — that even the best-attested means of projecting how much someone may like the sound of a set of headphones aren’t guaranteed to satisfy everyone. Even in the most important listener studies for headphones, distinct listener classes were identified, each with their own idea of what a good tuning is. In short: we can’t tell you what you’ll like, so it’s foolish to think that anyone can score something perfectly.
This happened a while back when the Harman research was changing how people viewed headphone reviews. Though there was an impressive predictive ability in the regression used to score potential listener preference, some people missed the memo that scores aren’t absolute.
A lot of people took this model (Harman) and started spitting out scores on the internet, and people would go through and… pick the highest score, not knowing that anything within seven of a rating is statistically tied. … You can’t reliably say, ‘I prefer this one over that one,’ and it discounts the fact that there’s different segments or classes of taste.” — Dr. Sean Olive, on interpreting projected listener preference scores
Many people want a nice, simple figure to make a perfect comparison between products at all times, but it just isn’t possible for the public at large. What people like varies quite a lot — or can be multiple different things at once. So what can we do to gain a better understanding of what people like? Ideally, you ask people. A lot of people. And you write down what they say.
Key misunderstandings of Mean Opinion Scores
Taking a glance at a MOS is an excellent way to ballpark people’s subjective impressions of certain things — but it’s not an objective rating of sound quality that all people everywhere will agree with 100% of the time. A score of 3.5 will not necessarily indicate that a certain set of headphones will sound better to everyone than a set of headphones that scores a 2.8. It’s important to understand a few key points before getting bent out of shape over score differences between products.
1. A Mean Opinion Score is not a You Opinion Score
In any collection of folks, there will be many who rate a headphone’s sound very differently from one another, and so should you from time to time. Any single respondent — or a significant number of them — can rate any product’s sound extremely poorly, but the MOS can still be very high. A Mean Opinion Score is also not scaled the same way that Amazon or other reviews tend to be scaled, meaning that there isn’t this weird rule where nothing can ever score below 50%. Consequently, a MOS can seem lower than it should be simply because you’re forcing your own beliefs onto it.
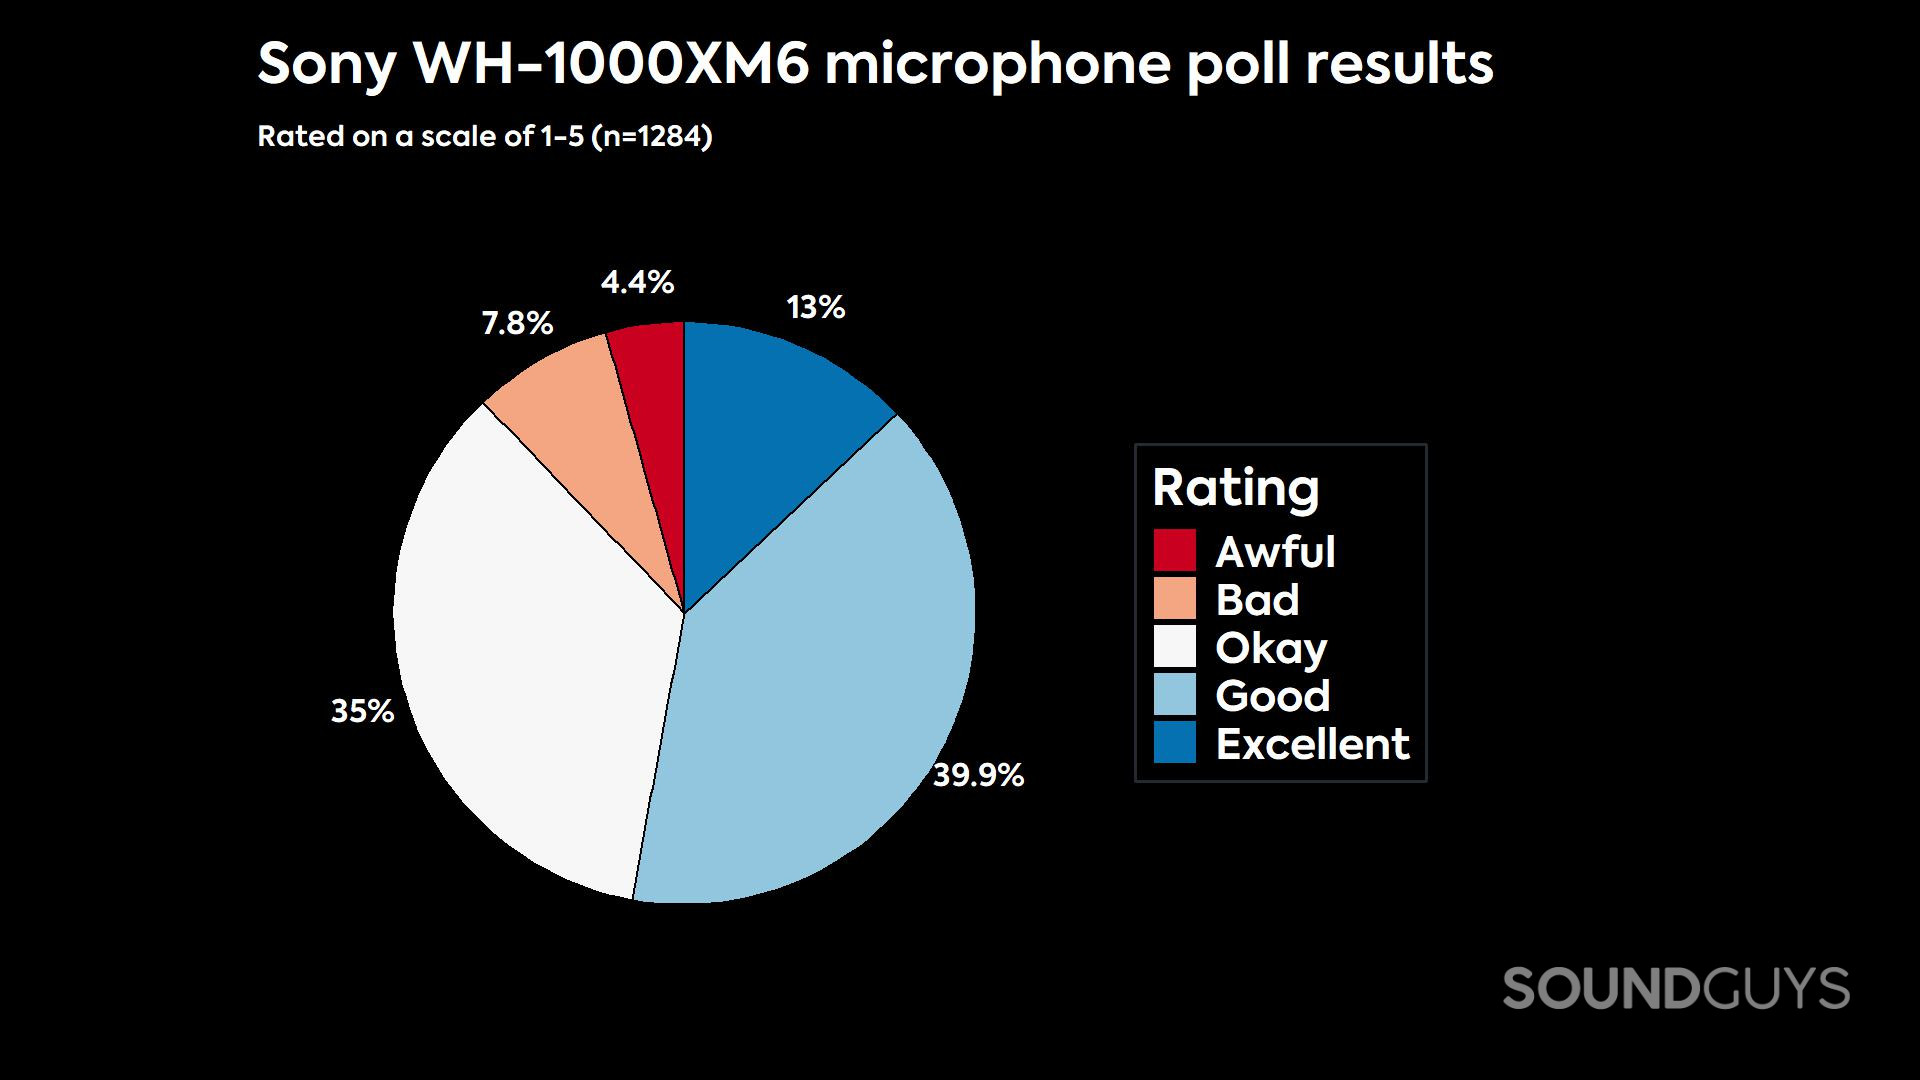
We often run surveys to determine whether or not people think a headset’s microphone is any good. We record a set of samples and invite our readers to listen to them, then vote on how good they think each product is on a scale of 1 to 5. Jim might really hate the samples, so he gives it a 1. Luna may really like the same samples, so she gives them a 4. Hundreds of other people all listen to the same clips, and offer their ratings too. After this survey is finished, we average all the responses given and chart them. But this uncovers some weaknesses of the MOS as a means of quantifying quality. The data below is a great example of this:

To you, the microphone quality score of 3.6 might seem wrong, but it’s not: we’re not looking at data for one person, we’re looking at a large group’s responses in aggregate. Despite the obvious positive bent to the data, there are enough respondents for each rating to drag the overall mean down below 4. In this case, a “lower” MOS means that while the group’s impressions are generally positive, there’s a small (but significant) number of people who don’t like it. In this case, it is more likely than not that someone will rate this microphone positively. With this scale, anything above a 3 is generally positive, and anything under is closer to mediocre. However, we’re talking about a large group of people here, so your impressions may not always align.
The main thing you should take away from a score between 2 and 4 is that a particular product isn’t clearly well-loved or hated. In these cases, you would need more information before making your purchase.
2. People’s opinions vary wildly
Mean Opinion Scores also don’t show the kinds of variance found in responses. If a product scores a 2.5 in MDAQS, it’s possible that someone might interpret that number as “bad,” when in fact they — and many other people — might love this particular tuning. In this sense, a Mean Opinion Score by itself isn’t ideal to rank product performance, but it is useful to project whether most people will like the sound or not. Just like target curves!
In our hypothetical sample data above, we’ve created a random dataset with a Mean Opinion Score of 3.5. As you collect more and more responses, this distribution will become more bell-shaped, or “normal.” But the Mean Opinion Score is unlikely to change very much. There are significant numbers of respondents who rated the hypothetical headphones 1/5 or 5/5, so each extreme is represented.
Now, consider how many people there are in the world. If you were to force everyone on the planet through this exercise, you might wind up with very similar results. But instead of 8 people disliking these headphones out of 200, suddenly these haters number in the hundreds of millions. Not so insignificant now, eh? This is precisely why a Mean Opinion Score should be viewed more as a temperature check than an infallible ranking system… and why we don’t do that.
3. The more extreme the score, the tighter the distribution
However, the opposite is true for scores at both extremes. The closer your mean reaches 1 or 5, the tighter the distribution has to be in order to achieve that score. So while there are lots of uncertainties around middle-of-the-road scores, there is a much higher degree of certainty the more extreme these scores get. Let’s look:
It’s curious, but then again, numbers rarely tell us the stories we want them to. The main takeaway here should be that it’s extraordinarily difficult to score at either extreme, good or bad. Should something approach or exceed a 4, there’s a high probability that most people will like it, and if something scores a 2 or below: there’s a really good chance it sounds awful.
How you should read each Mean Opinion Score
Okay, that’s a lot of nerd talk. So what? How should you read any possible score from MDAQS, microphone polls, or other survey data? Well, I’ve made you a cheat sheet.
| Mean Opinion Score | |
|---|---|
1-1.9 | Read the review (it will be funny) |
2-2.9 | Read the review for more information |
3-3.9 | Read the review for more information |
4-5 | The product sounds good (but read the review for additional information) |
That may seem like a cop-out, but that’s really the truth. A Mean Opinion Score on its own doesn’t tell you specifics like a frequency response chart or a reviewer could. However, it can tell you if there’s a strong chance most people like something or not — it’s just a piece of the puzzle, not the entire picture. By offering our listening impressions, a projected Mean Opinion Score via MDAQS, and objective measurements in every review, we provide our readers with access to different aspects of the discussion that often get ignored. Though we won’t ever be able to get you to instantly understand everything at once, we can offer you most of the information you’ll need to learn whether you’ll like something or not.
Thank you for being part of our community. Read our Comment Policy before posting.
